
Find contact imported
Once you import a contact into HubSpot via Hublead, you can find them using specific HubSpot properties like 'Original Source', 'Original Source Drill Down 1', and 'Original Source Drill Down 2'.
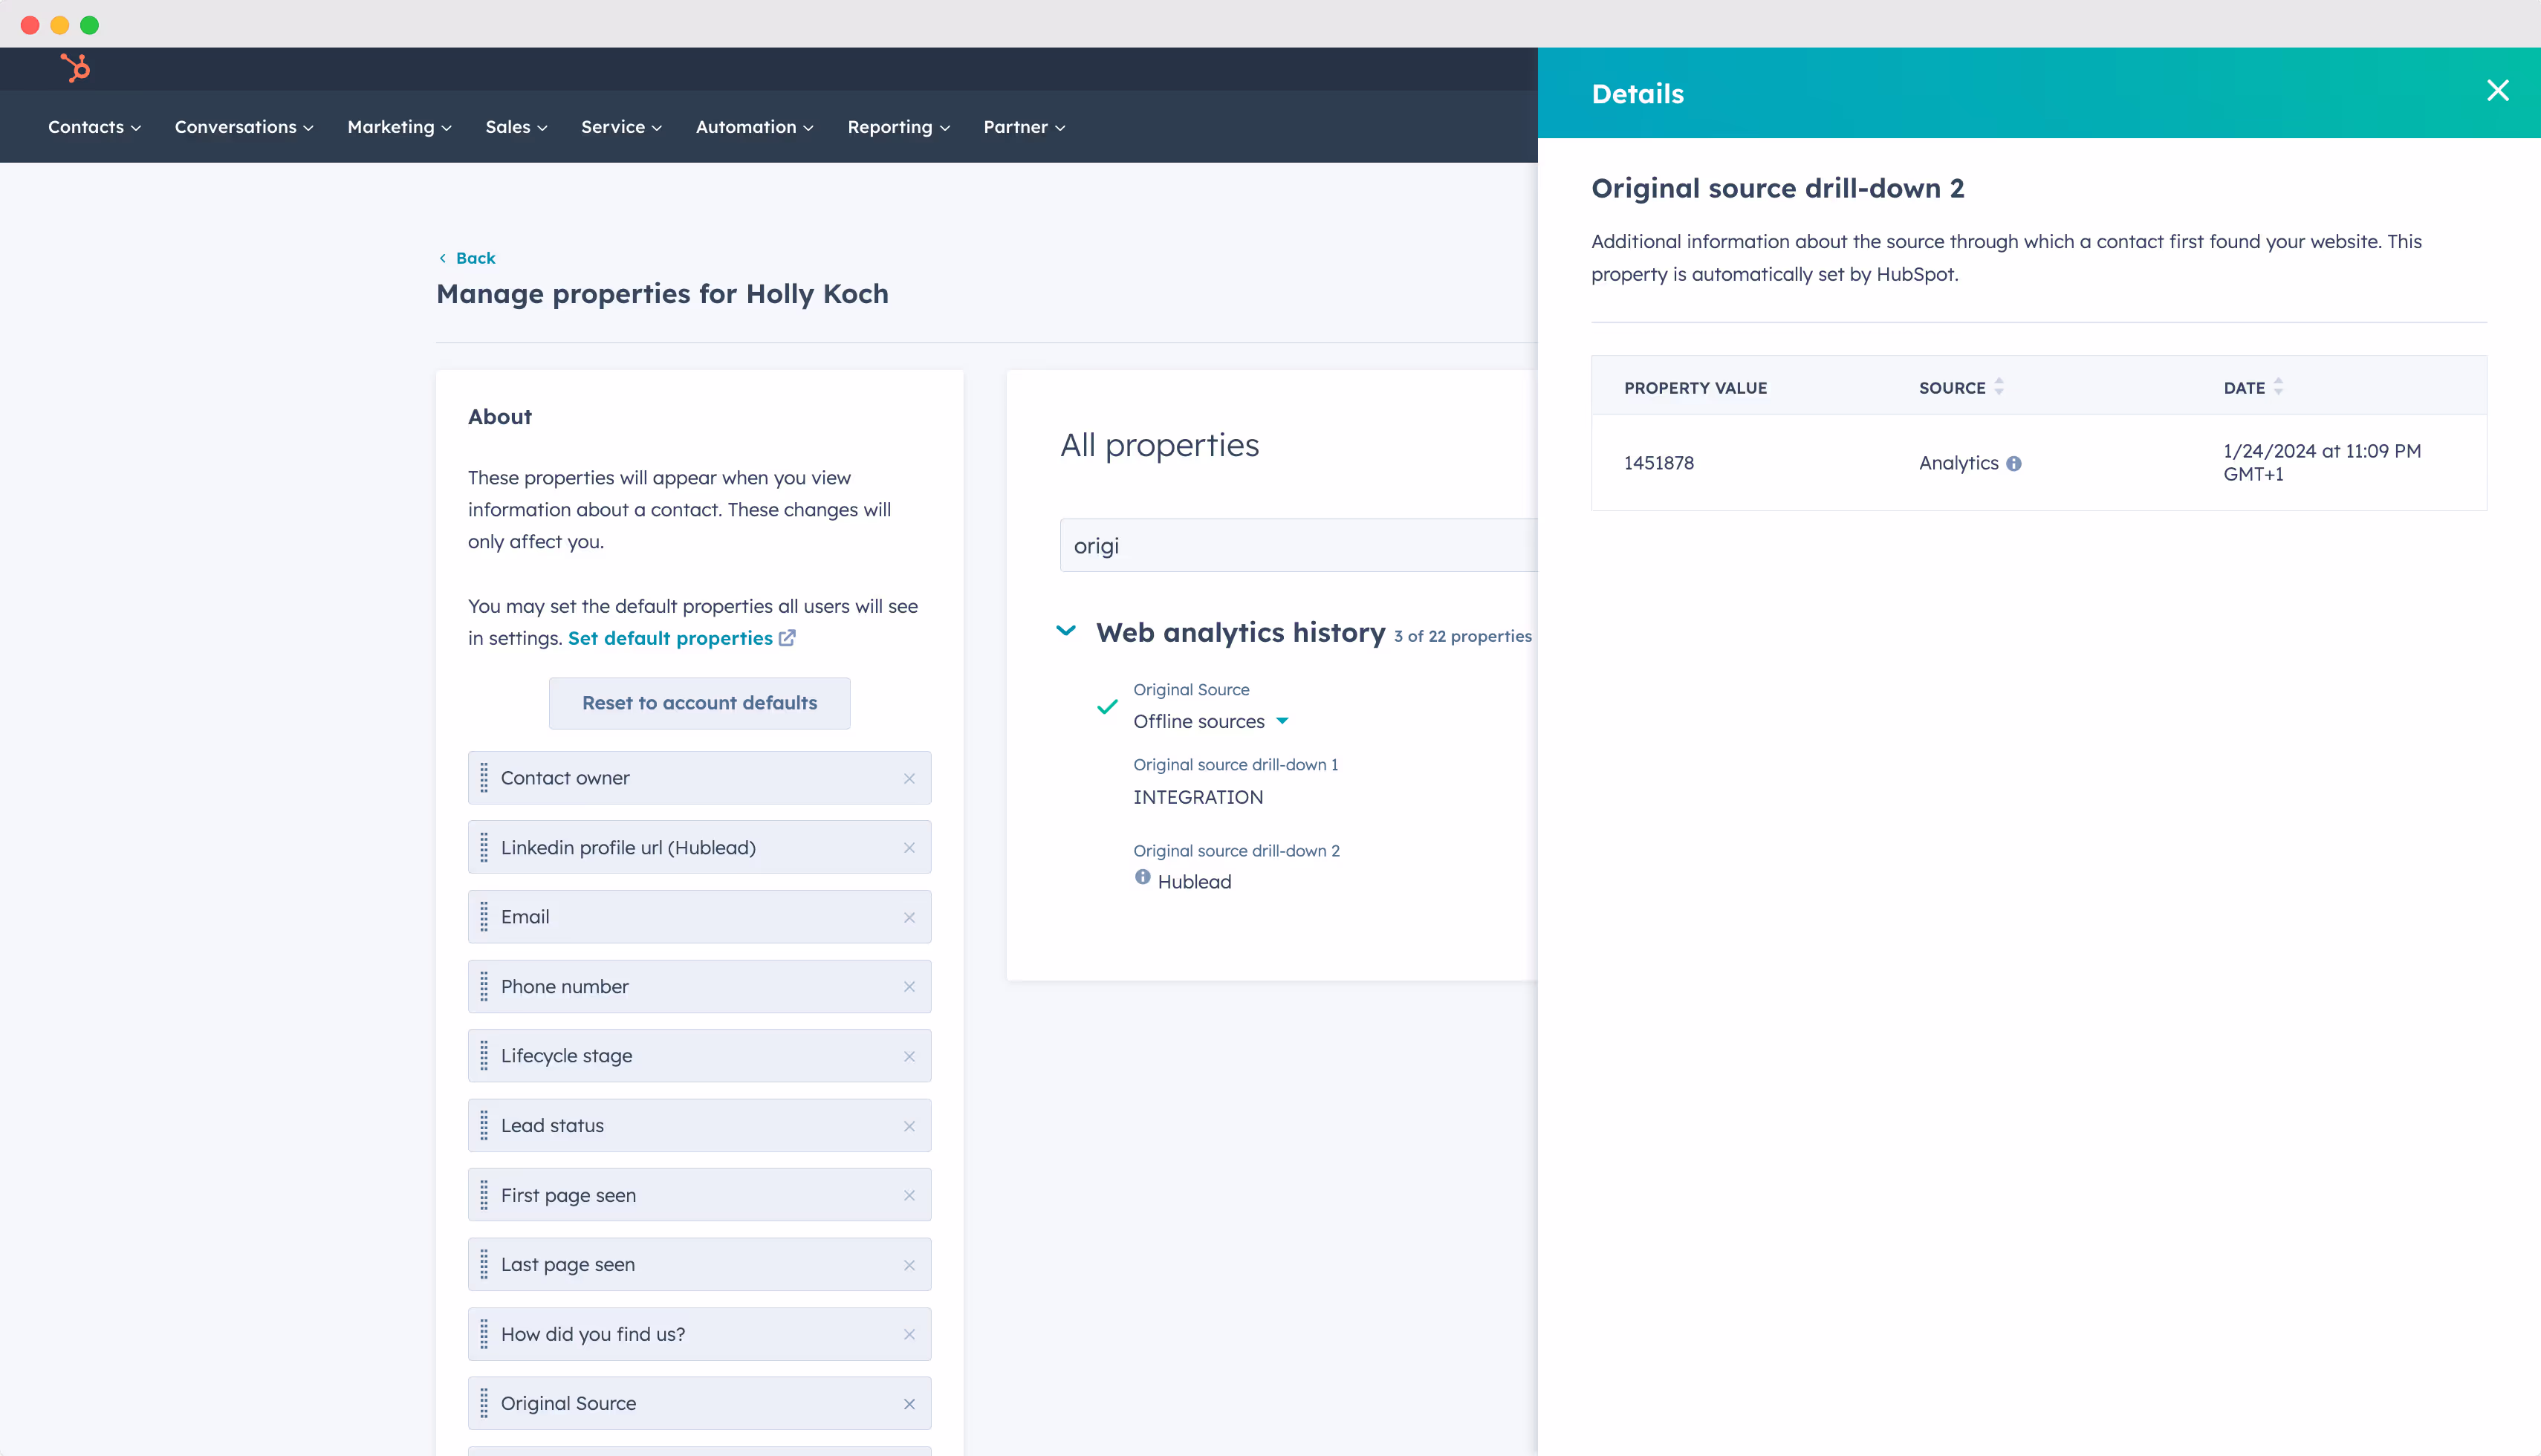
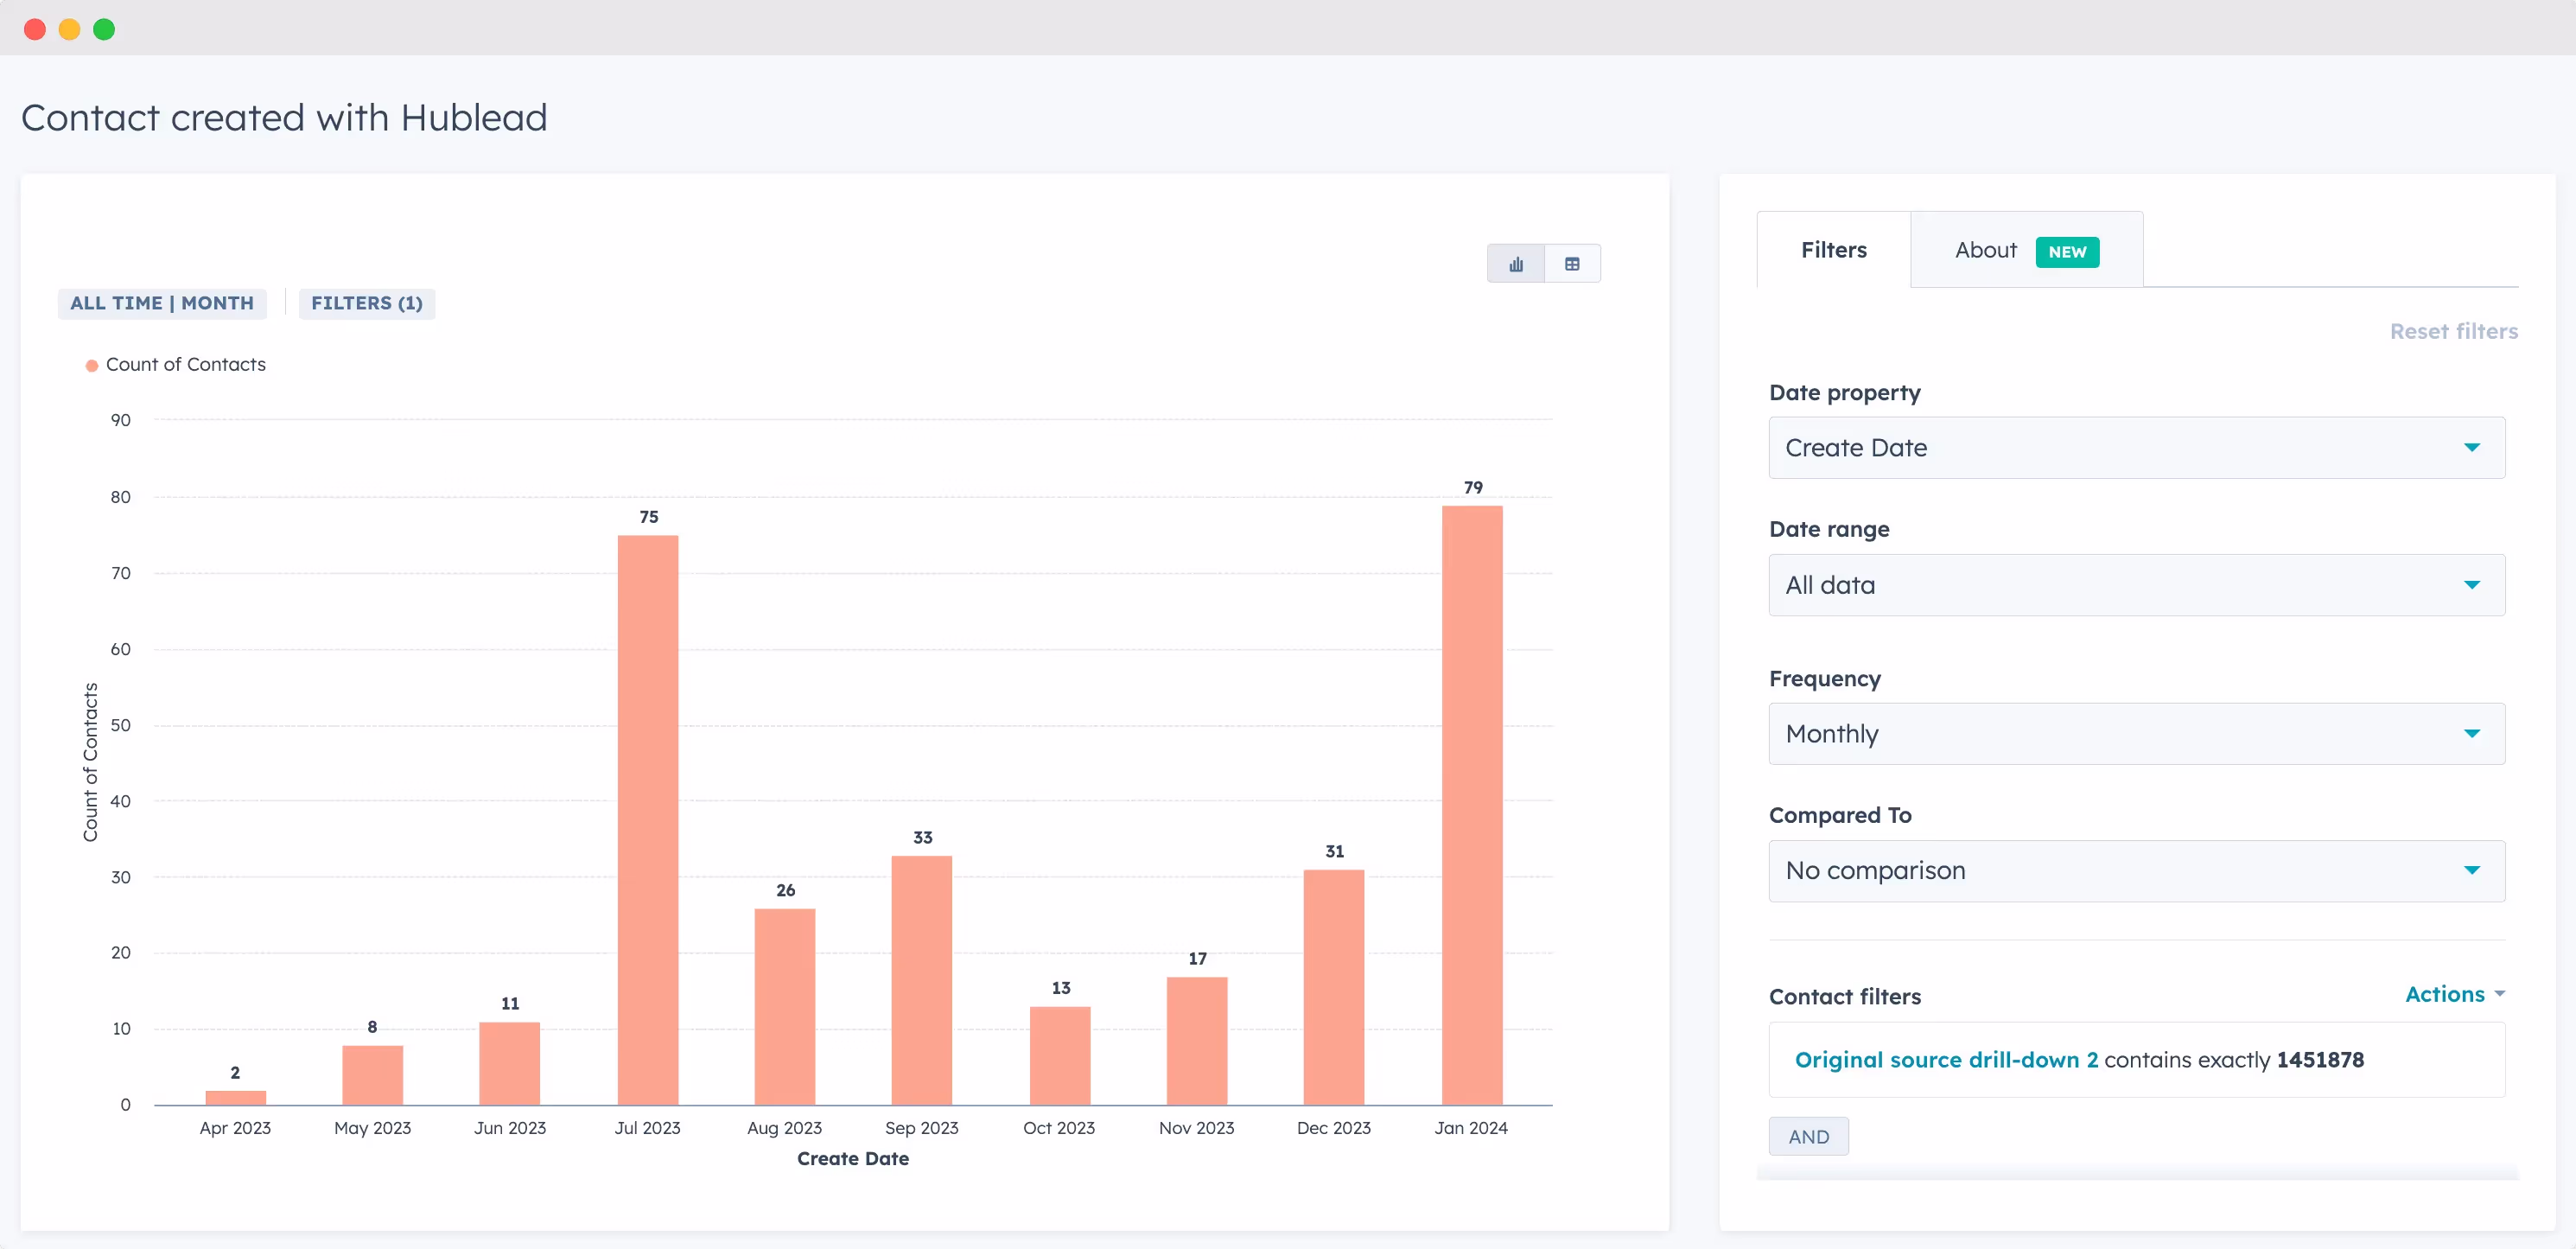
Filtering Contacts
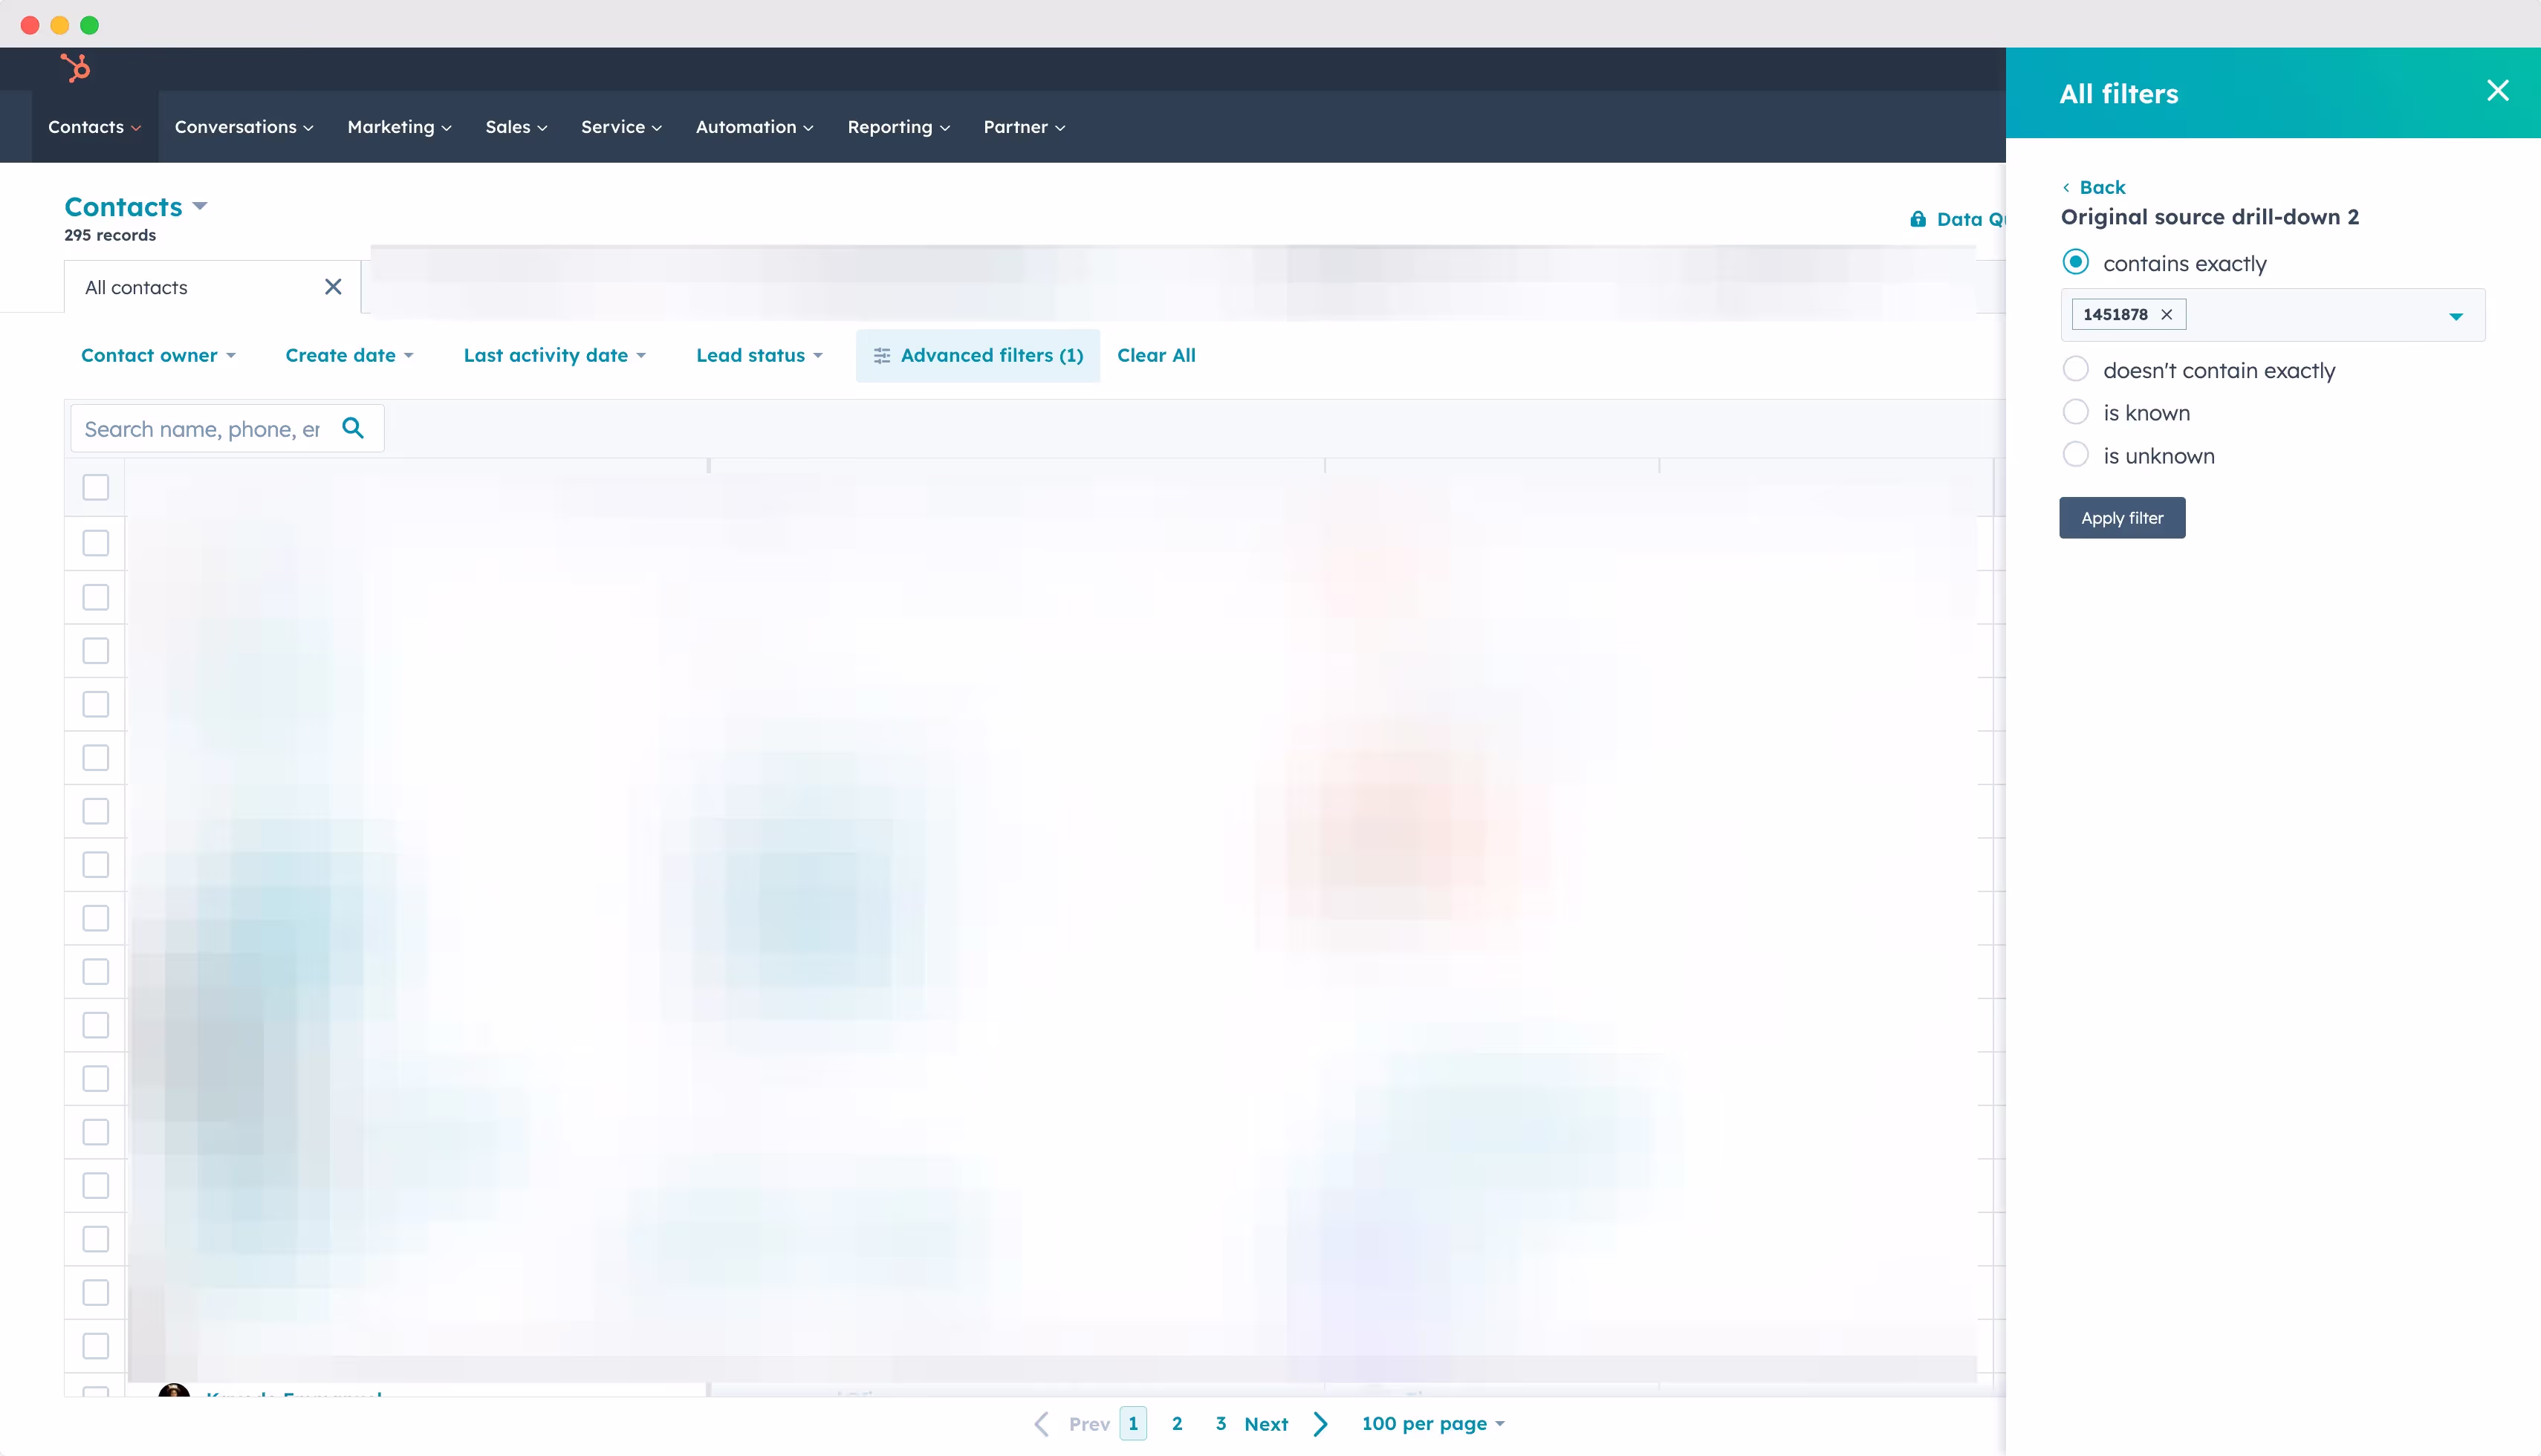
Create a filter in your HubSpot contact view using 'Original Source Drill Down 2 = 1451878'. This helps you easily identify contacts imported through Hublead.
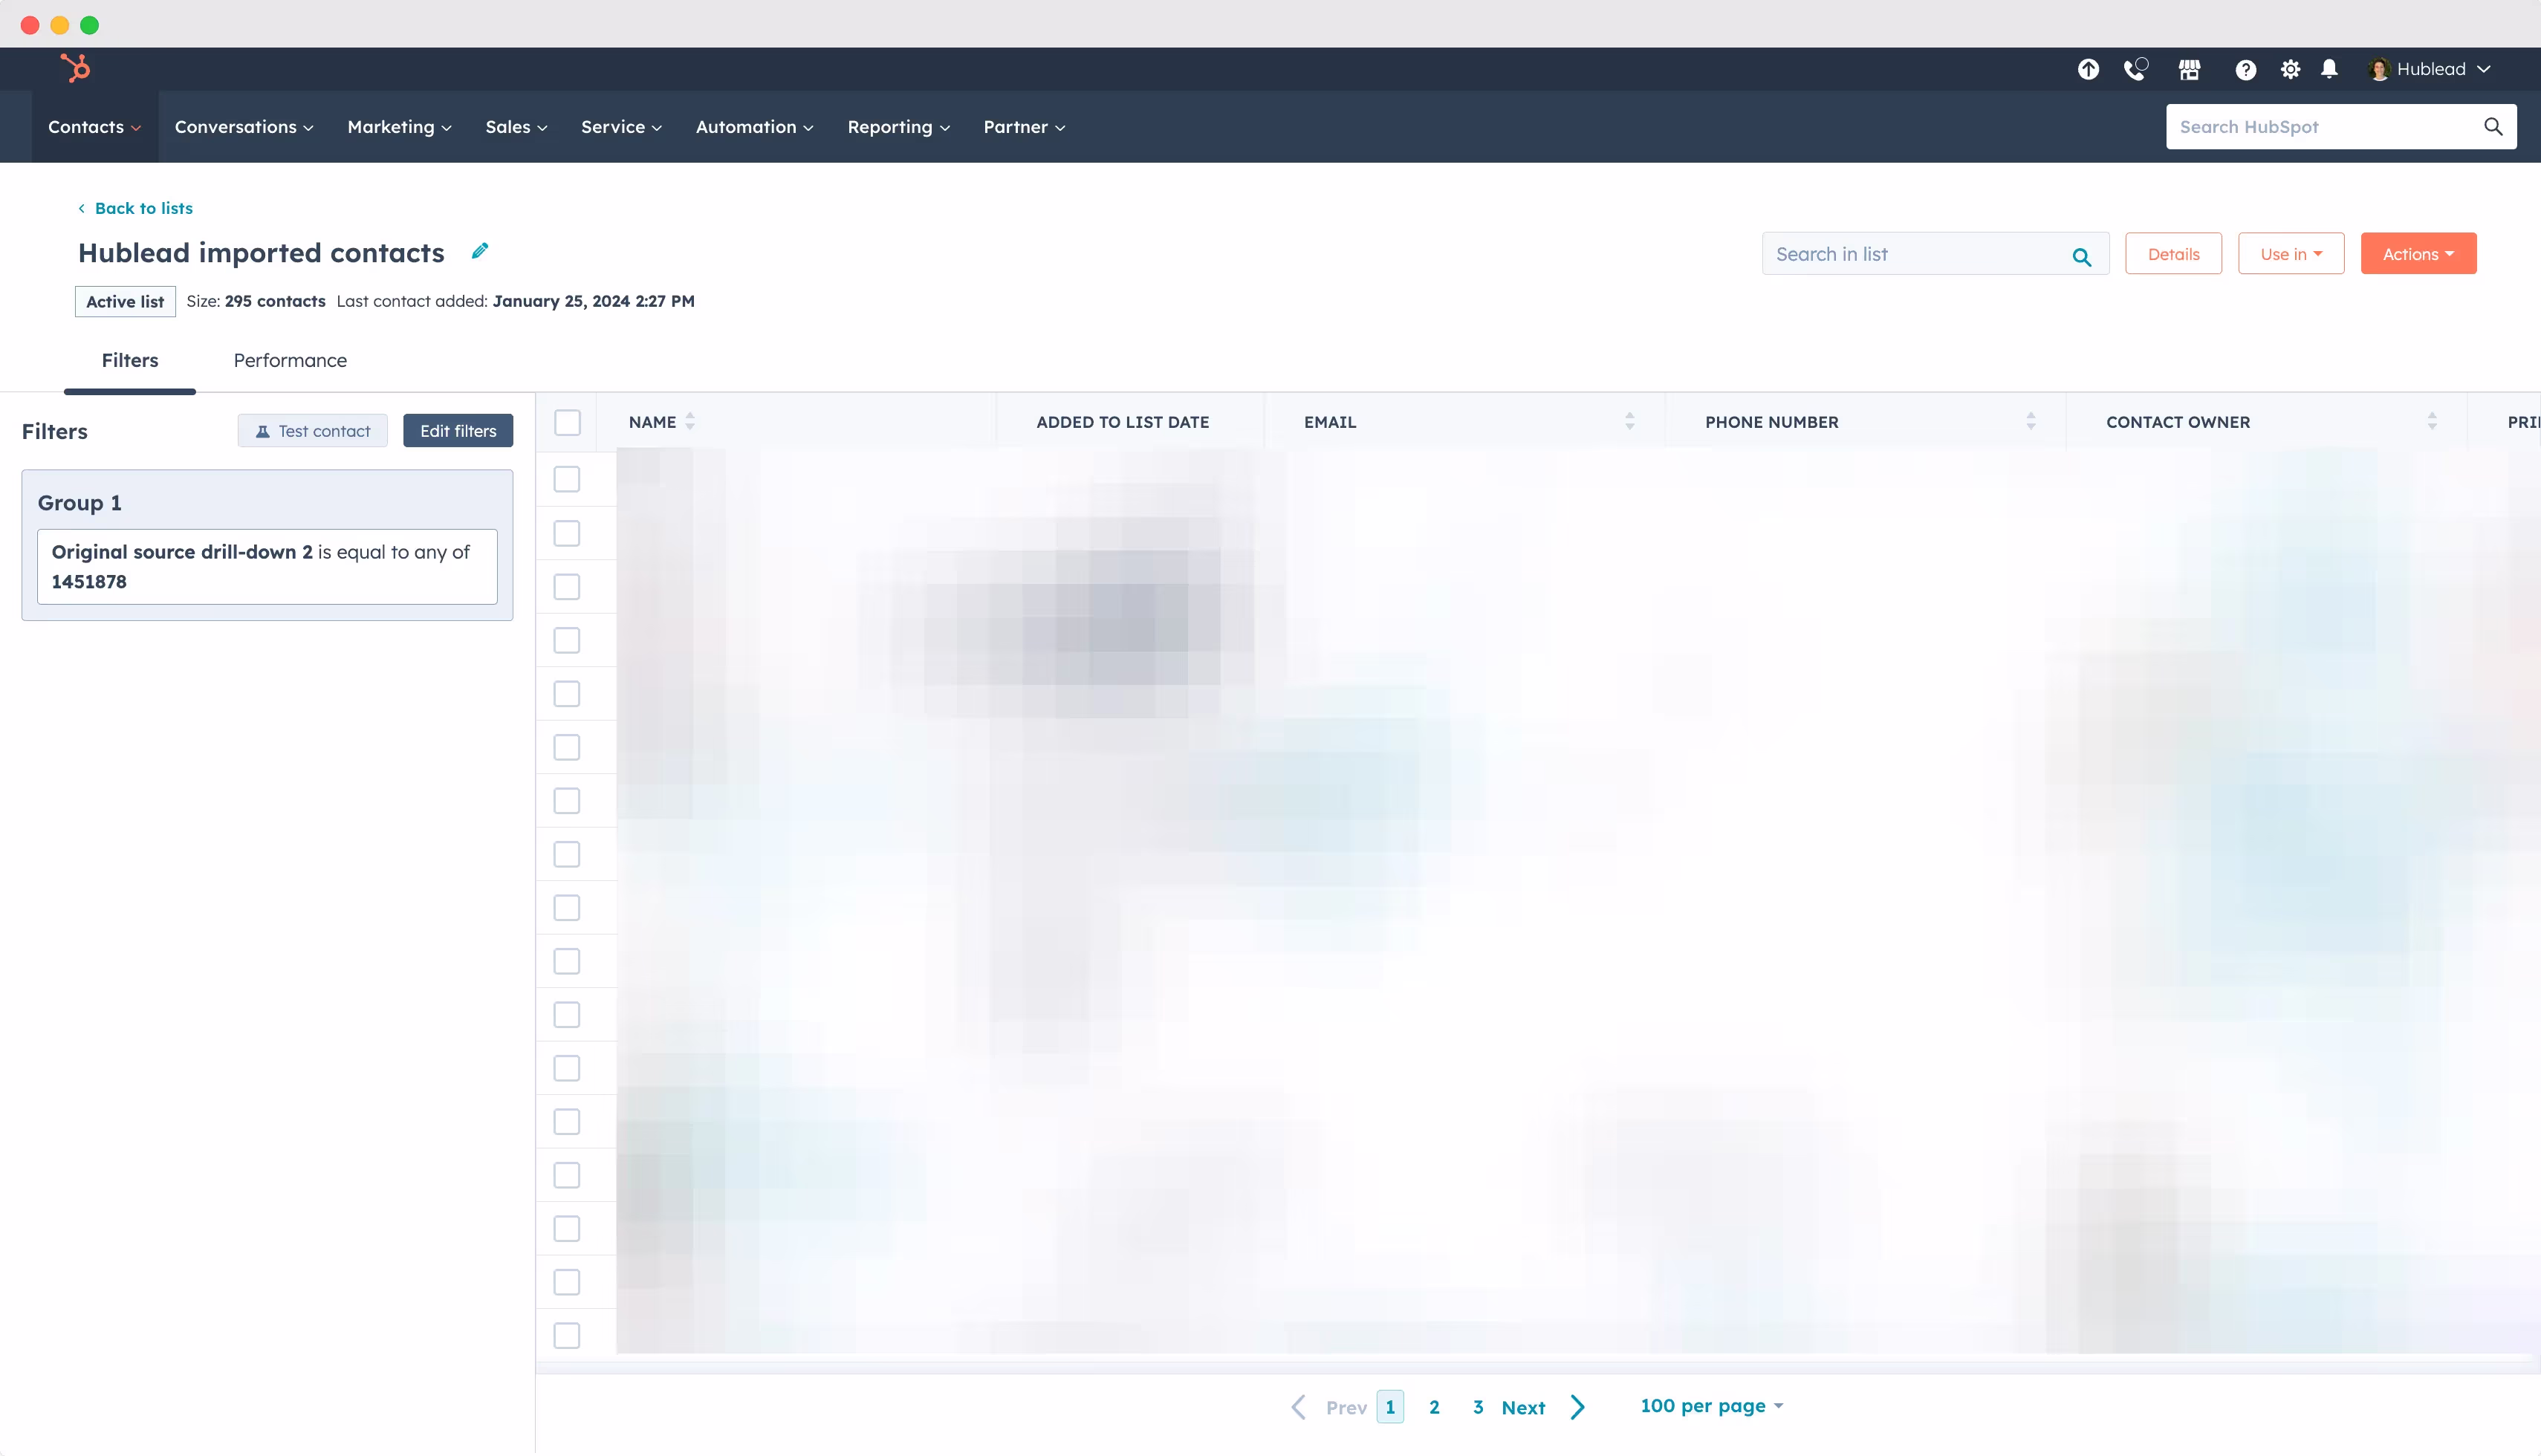
Creating Lists and Workflows
- You can create a HubSpot list for these specific contacts for better organization.
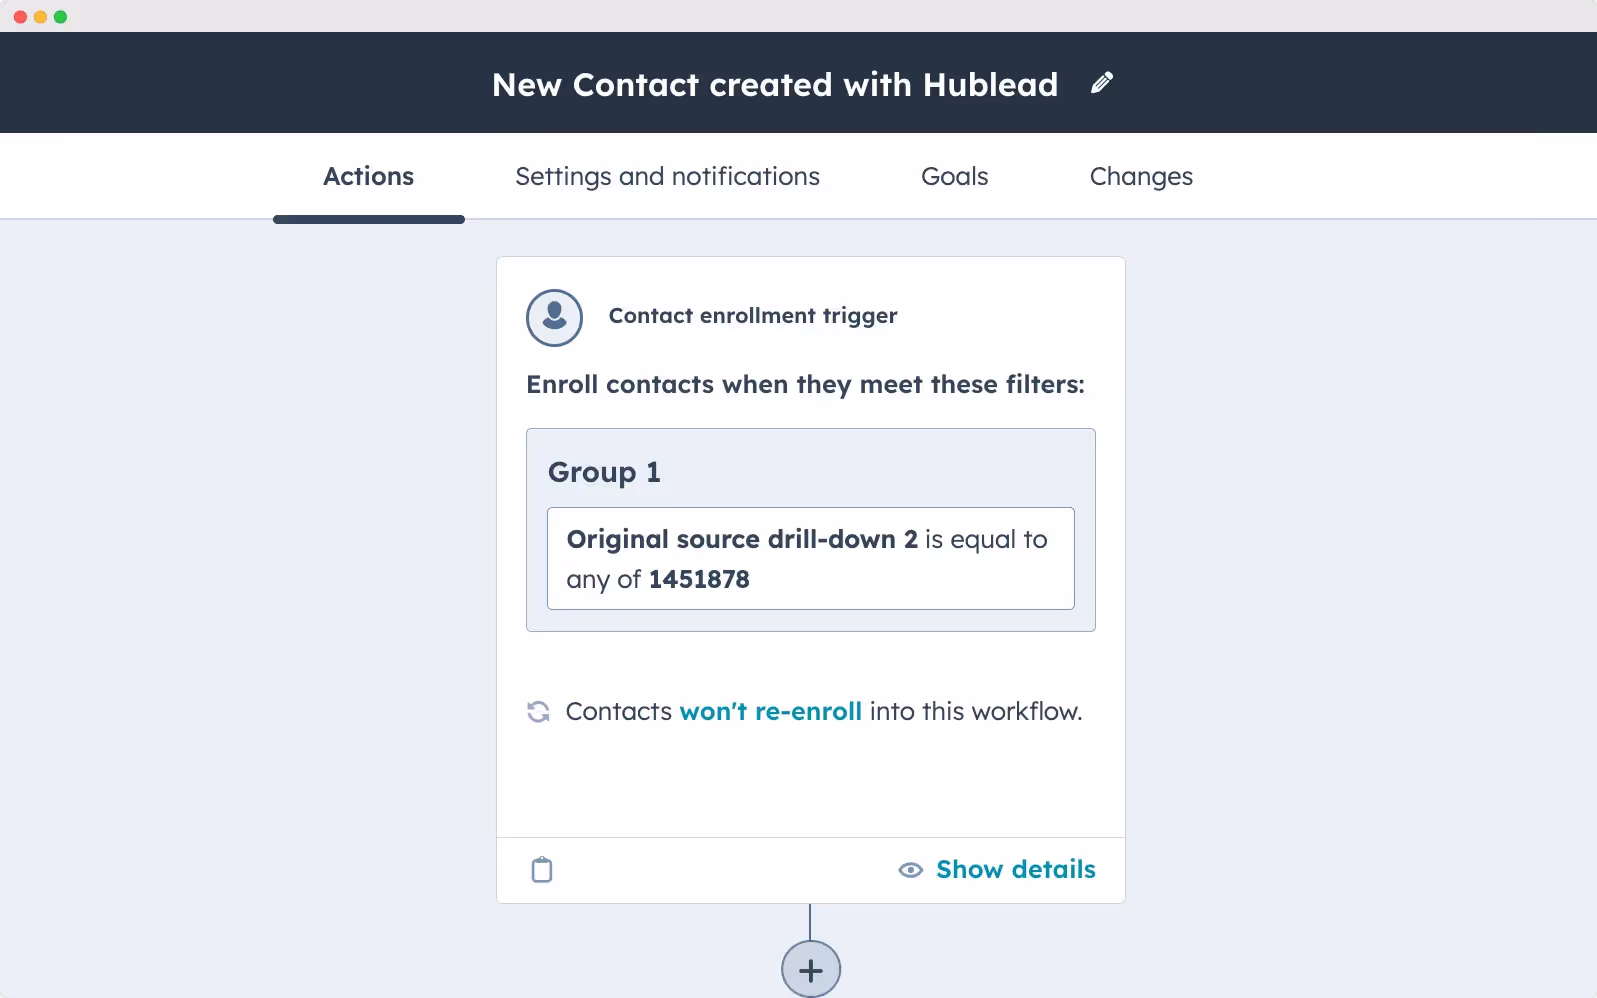
- Set up a workflow in HubSpot to automatically add new contacts with this source to sequences, particularly useful for HubSpot Sales Enterprise users.
Alternatively, create a list of these contacts, check who isn't in a sequence, and manually add them in batches (e.g., 25 at a time) to a sequence either from the list or directly in HubSpot.
Reporting
Generate reports to track how many contacts each sales representative has imported, providing insights into team performance and import activity.
This process ensures efficient management and tracking of contacts brought into HubSpot through Hublead, enhancing your sales and marketing efforts.
HubSpot LinkedIn Message report
1. Create a Single Object Report
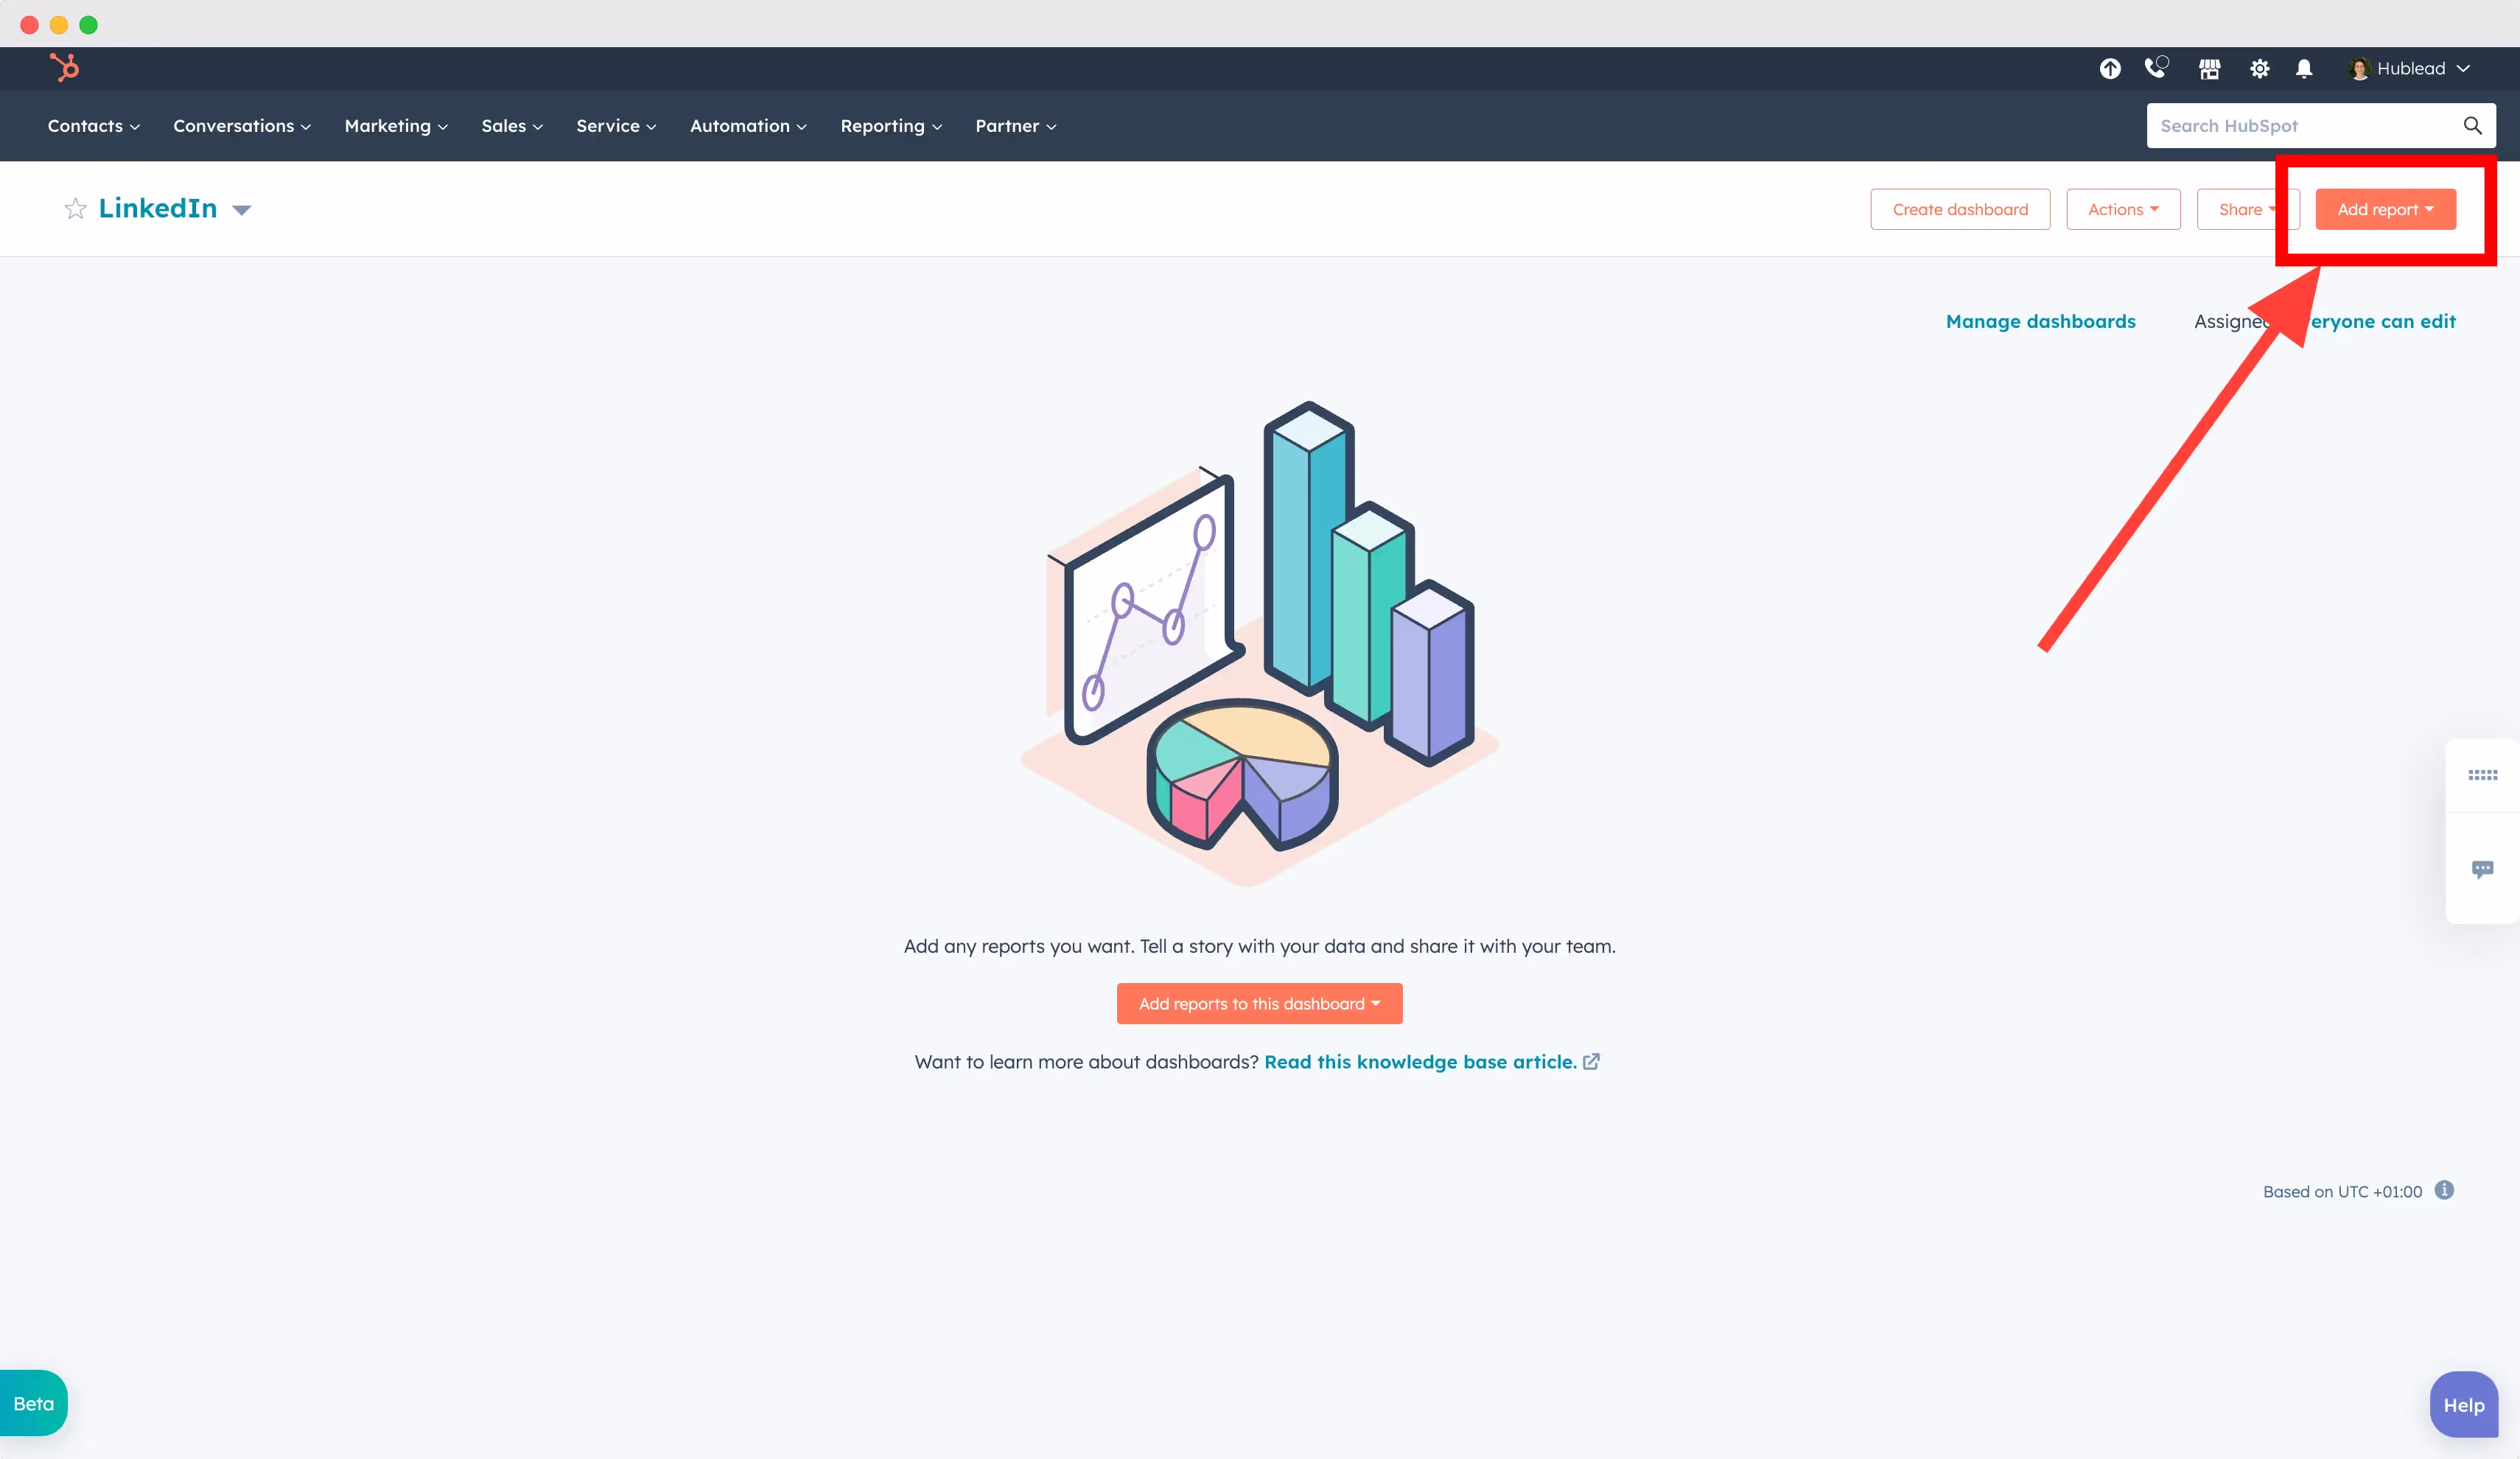
A. Click on "Add Report" on any Dashboard to create a new report.
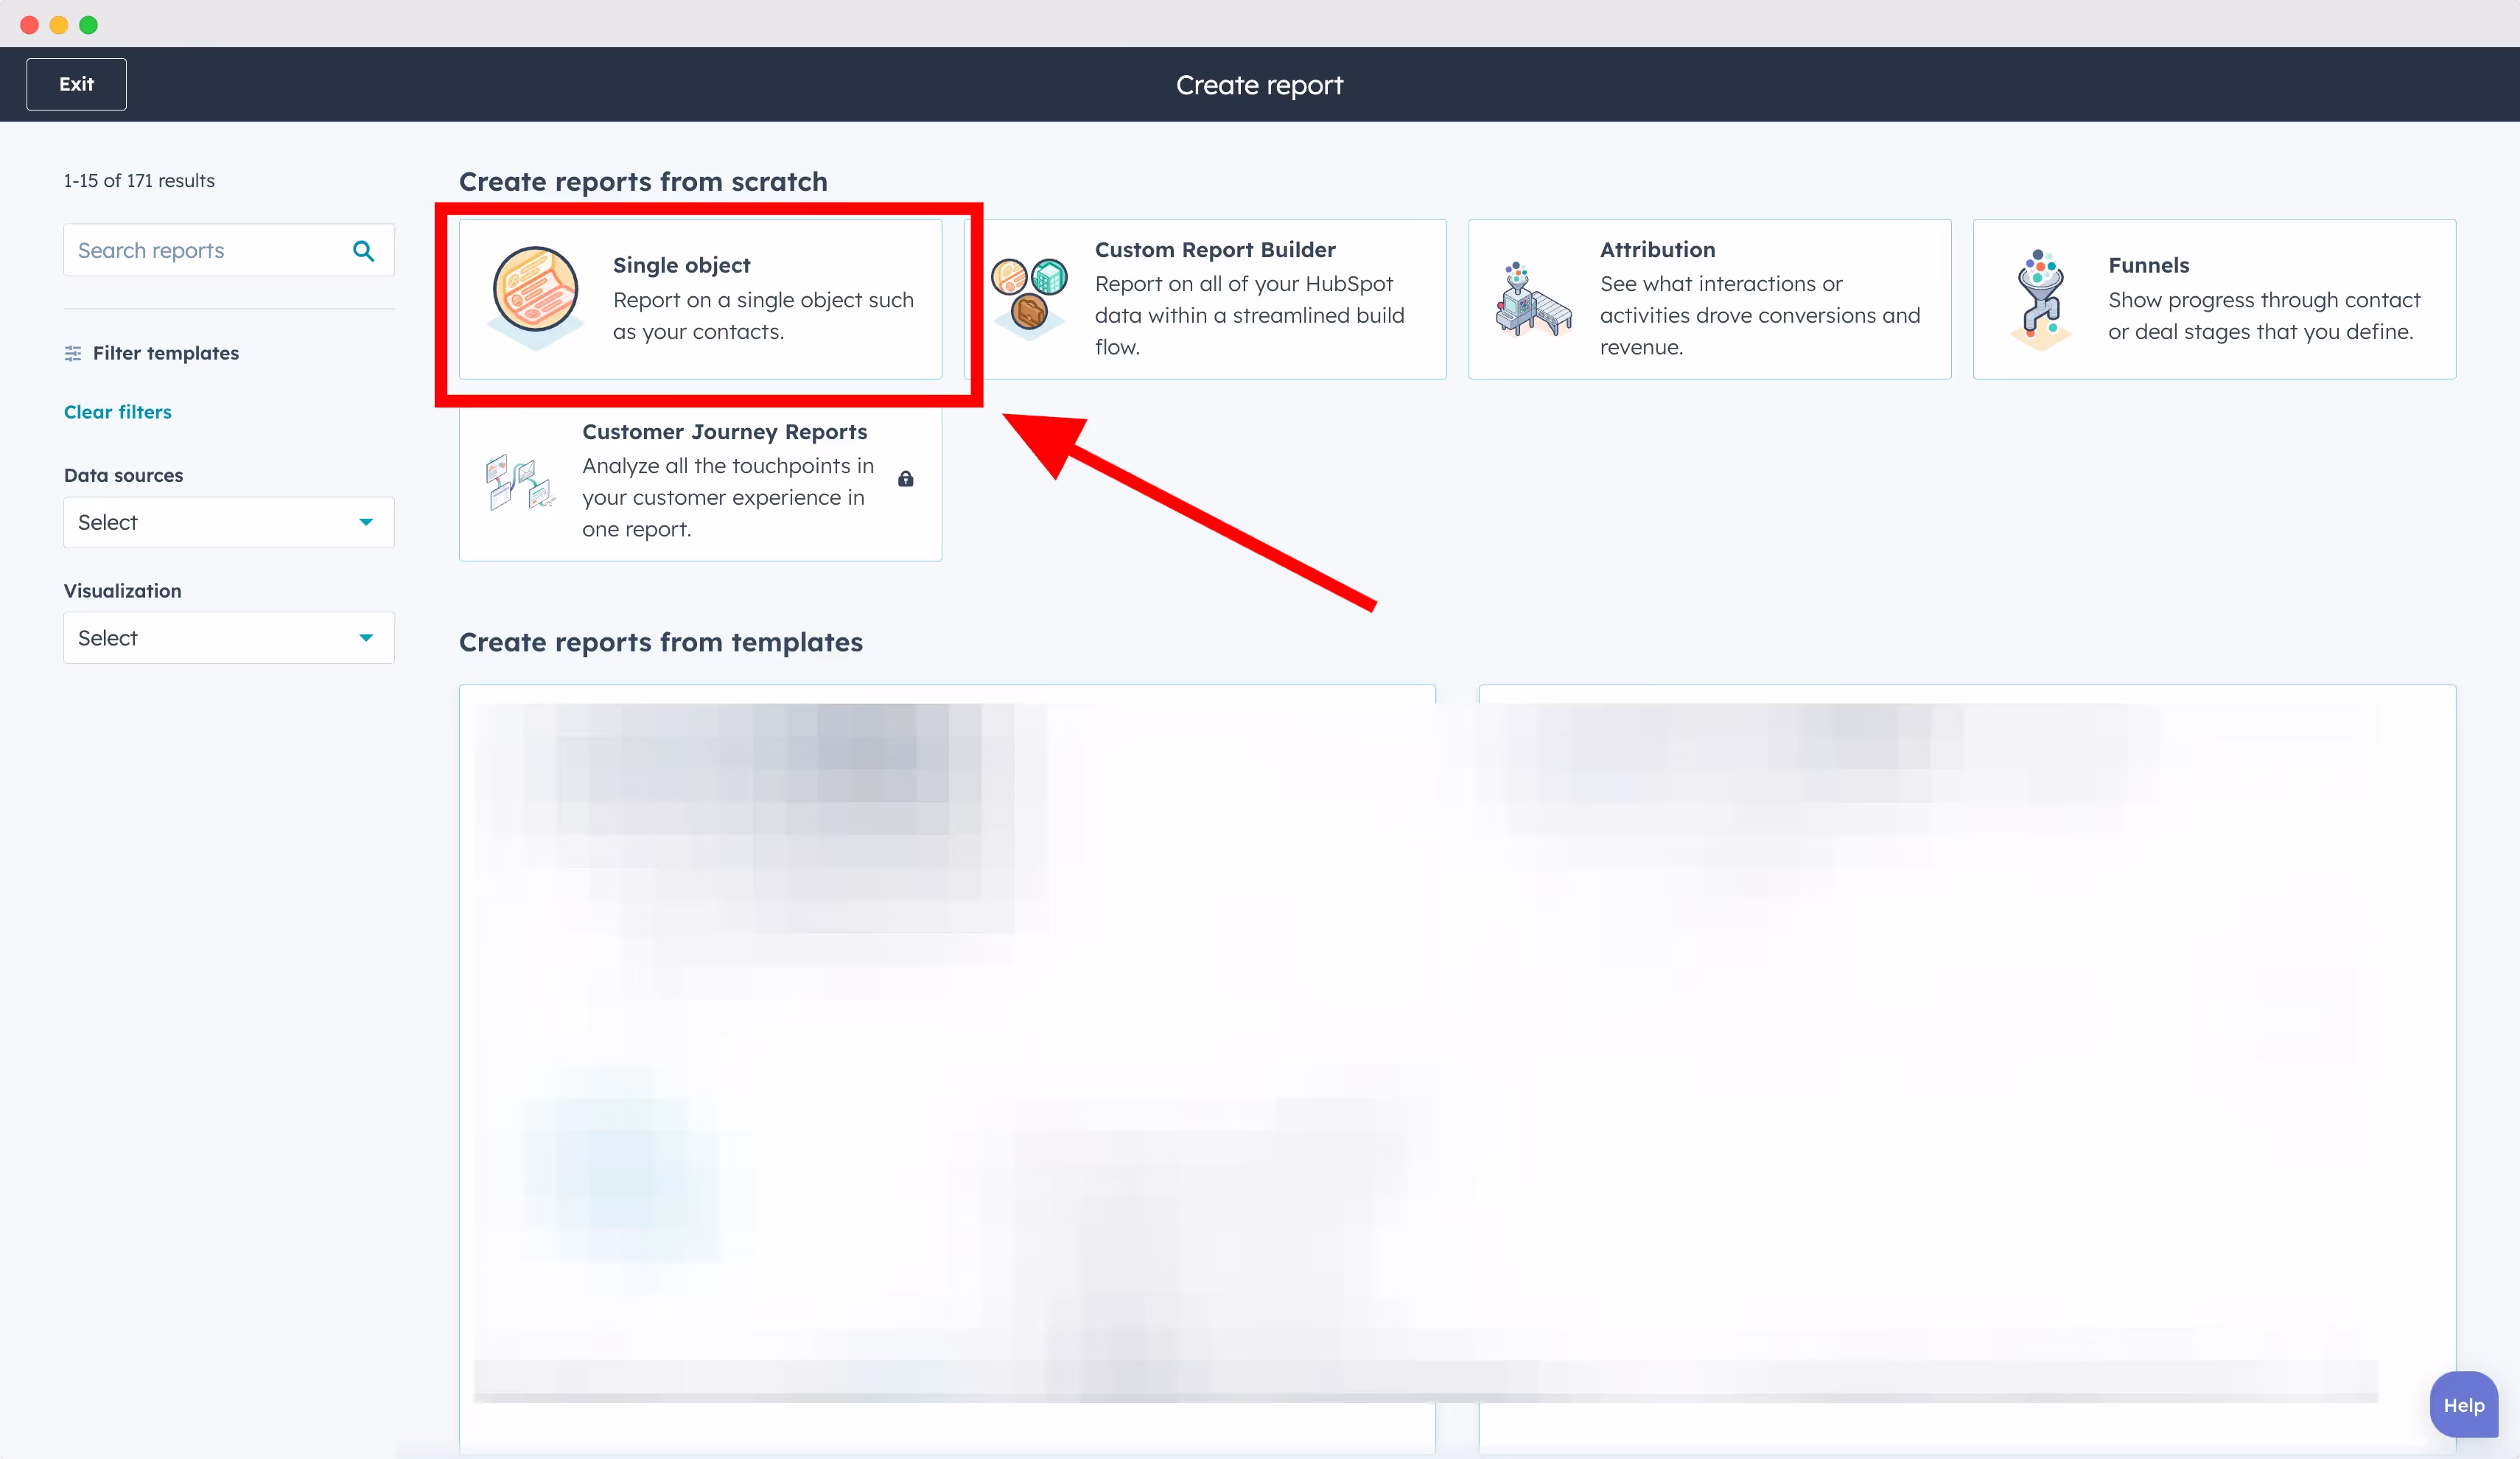
B. Click on "Single Object".
2. Configure your HubSpot Report
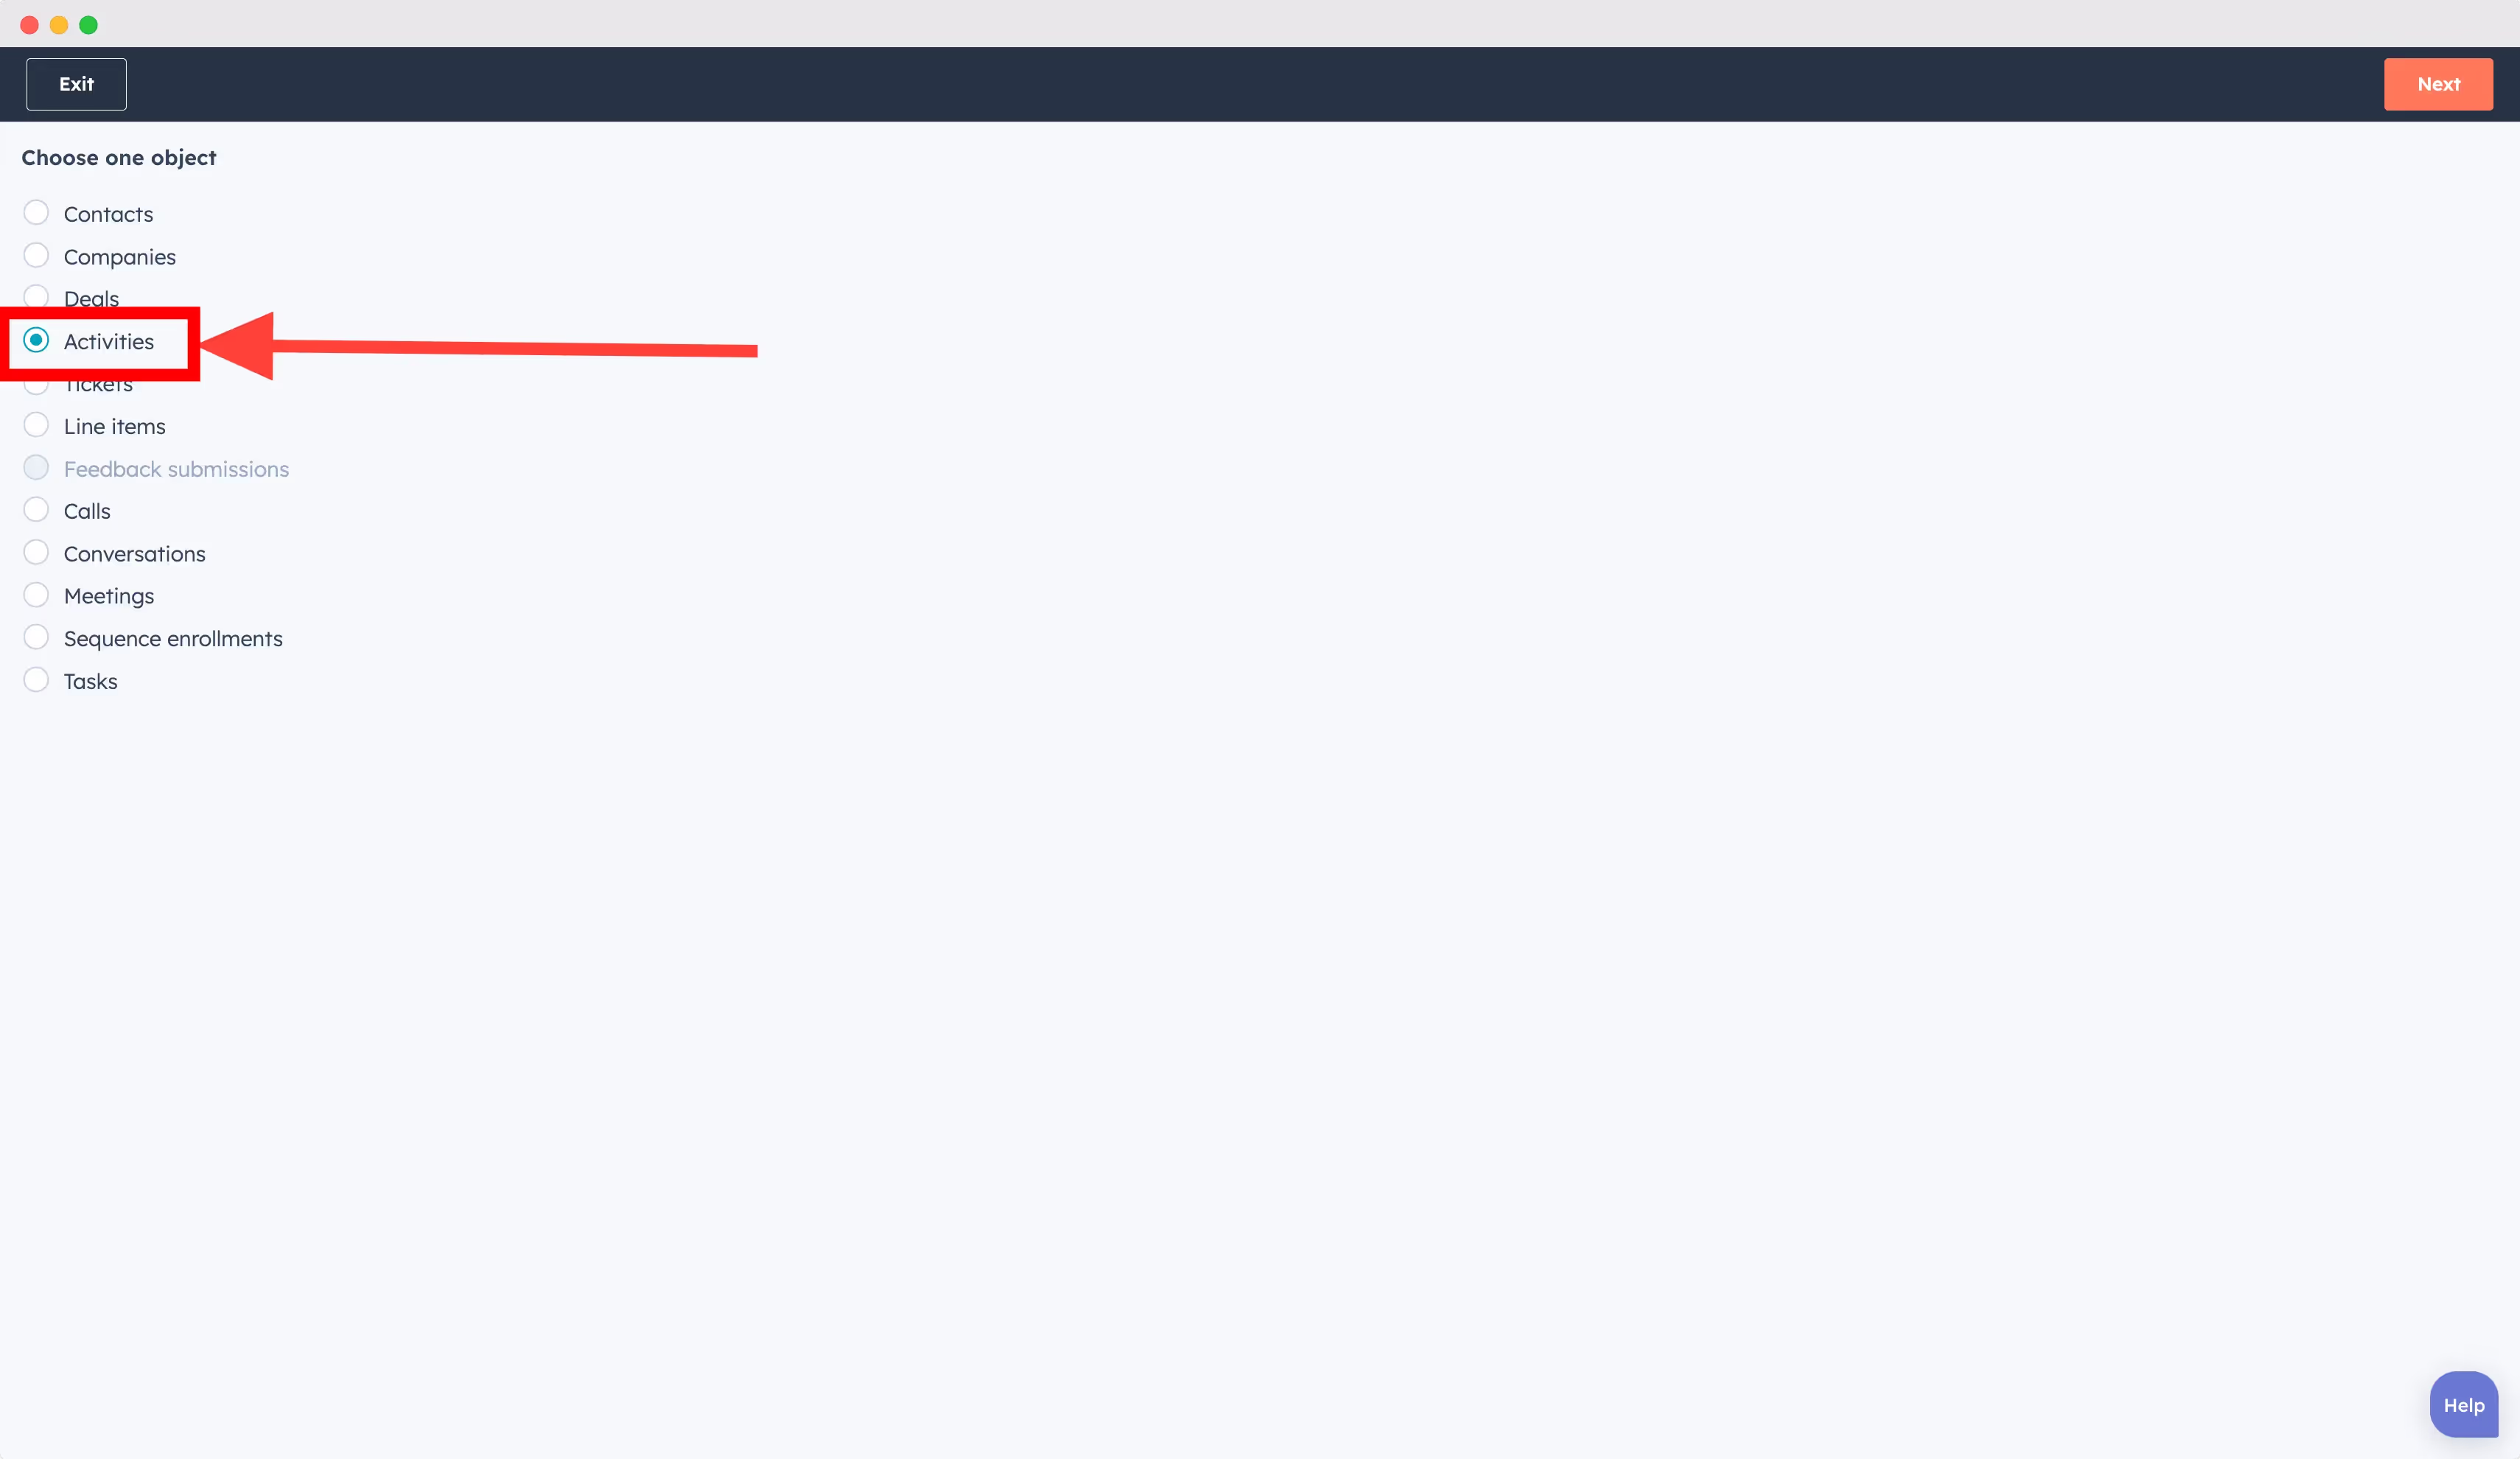
A. Select "Activities" to create a report based on activities.
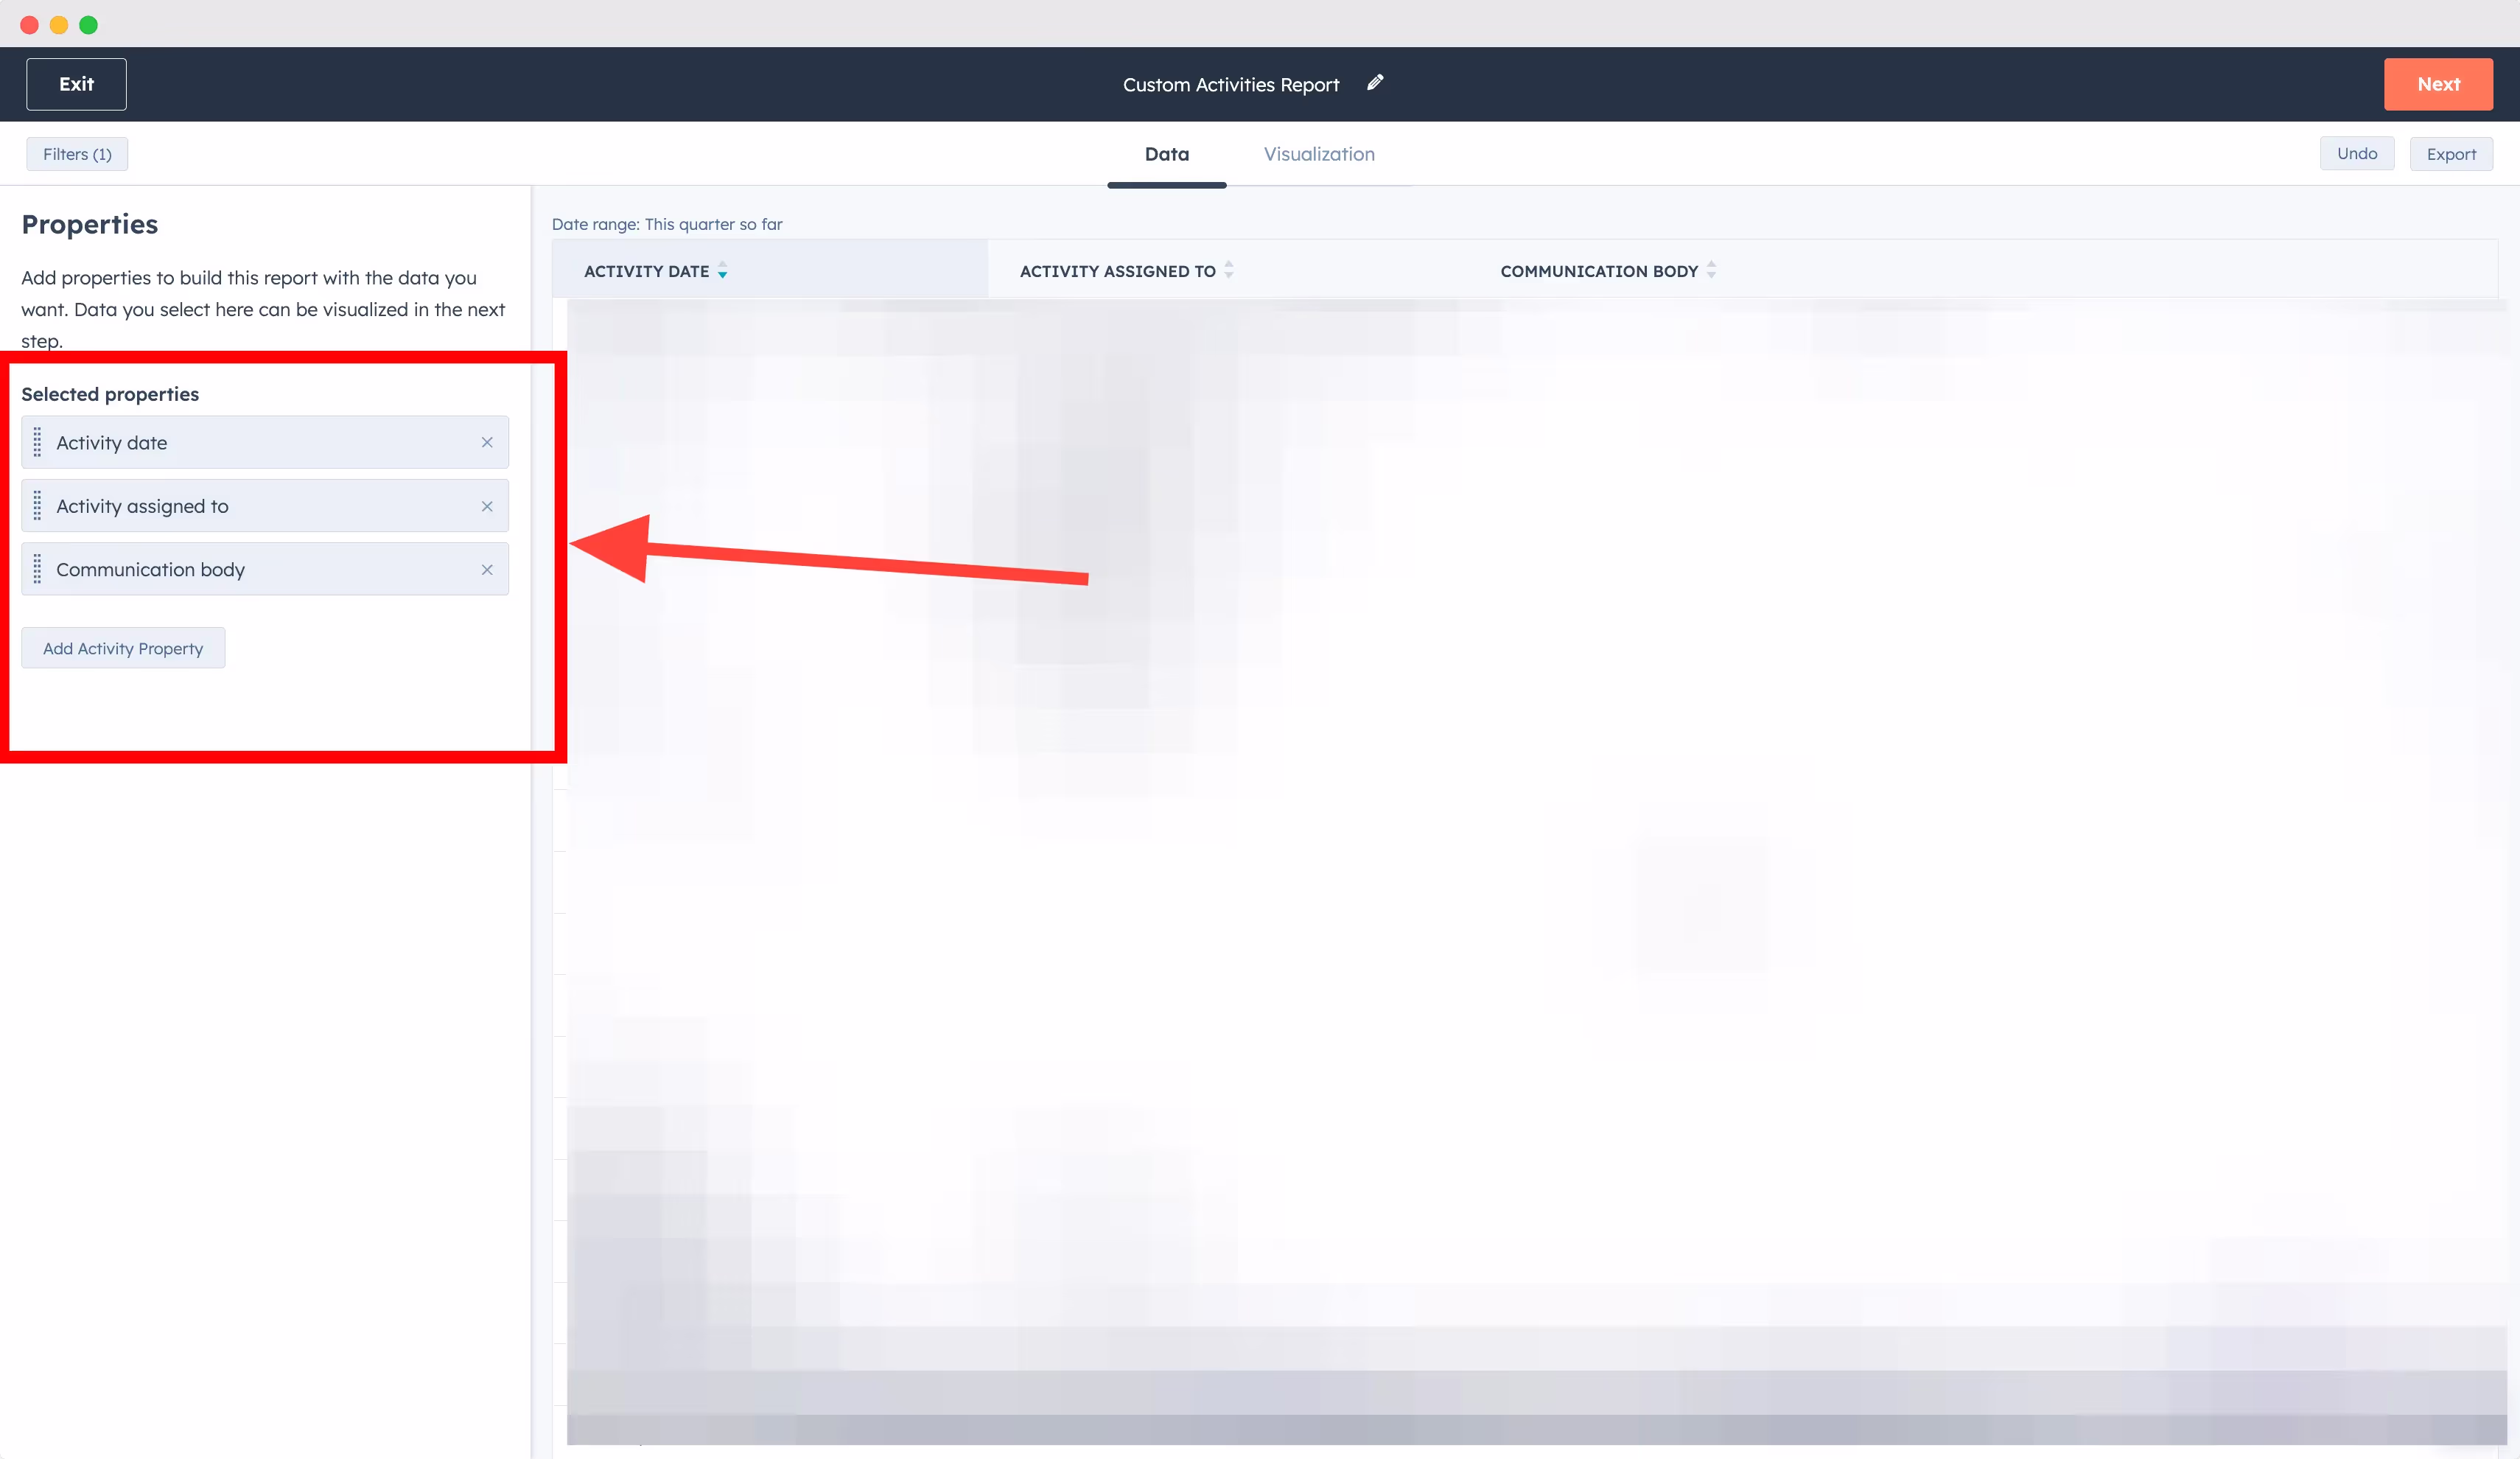
B. Select HubSpot properties
- Activity date (Data of the messages sent on LinkedIn)
- Acitivity assigned to (HubSpot owner who logged the conversation)
- Communication body (content of the conversation)
You can of course display more HubSpot properties!
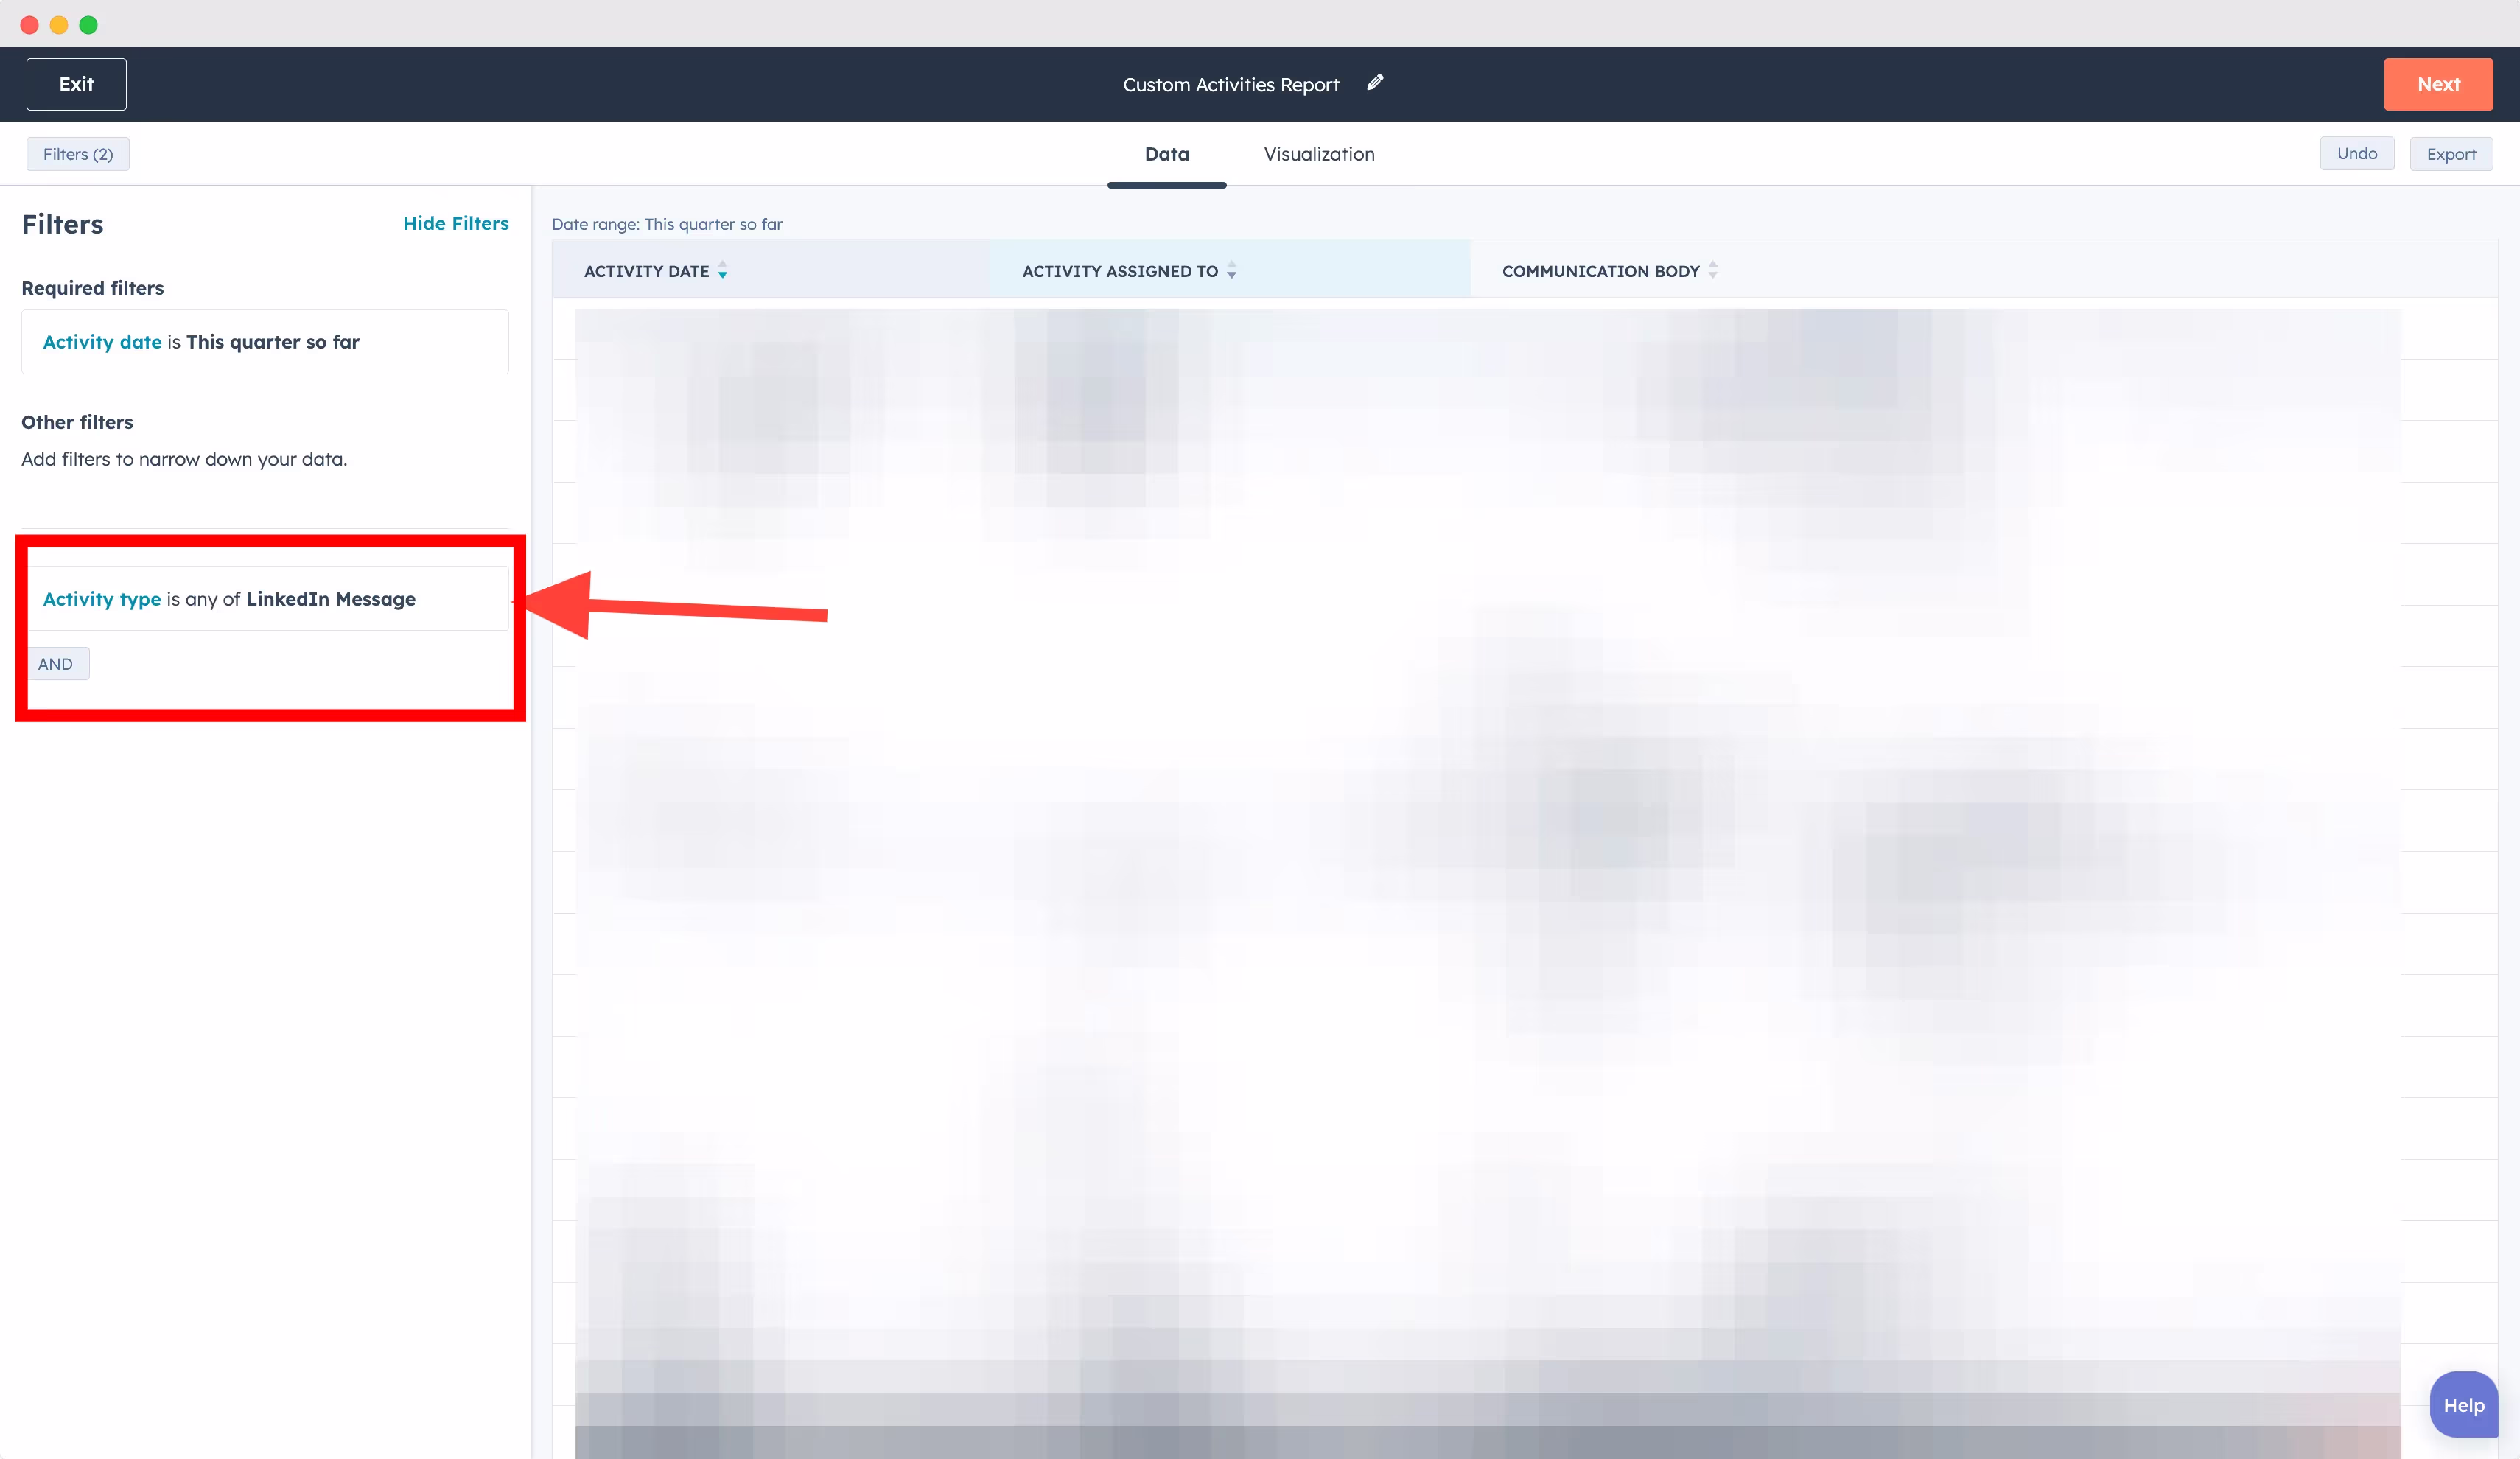
C. Select a new filter "Activity Type" is any of LinkedIn Message
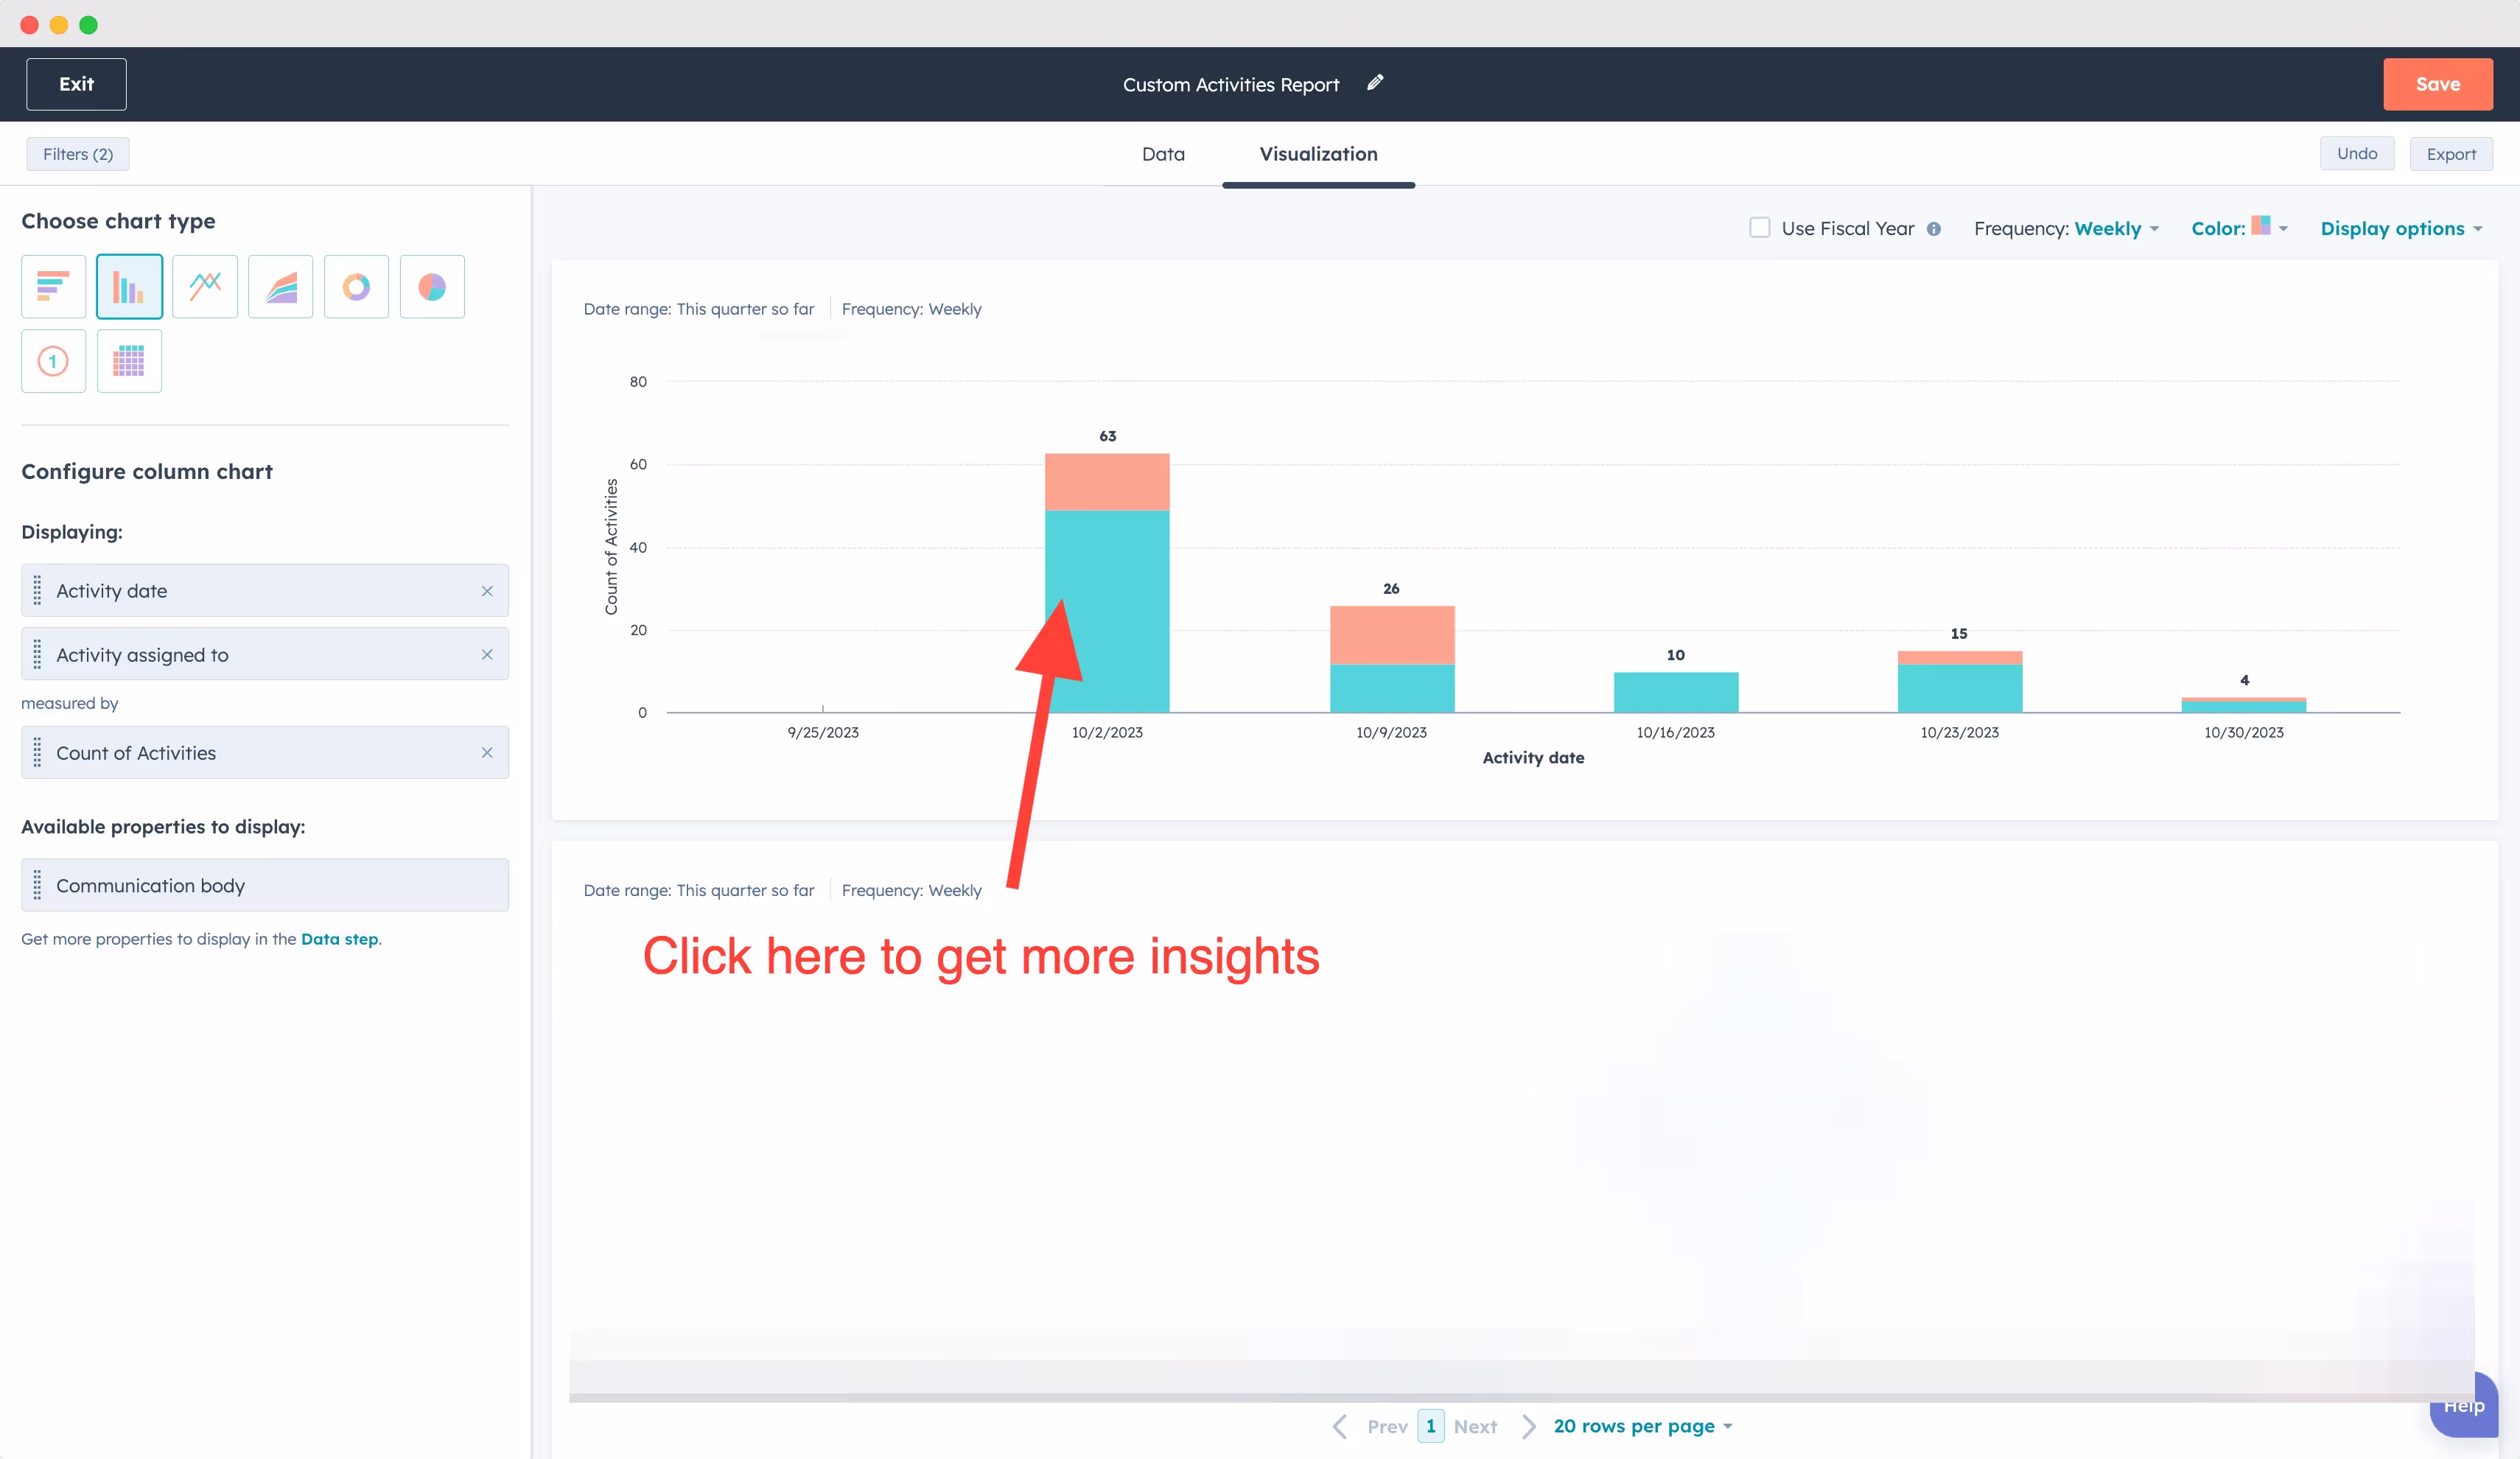
3. Configure your HubSpot Report
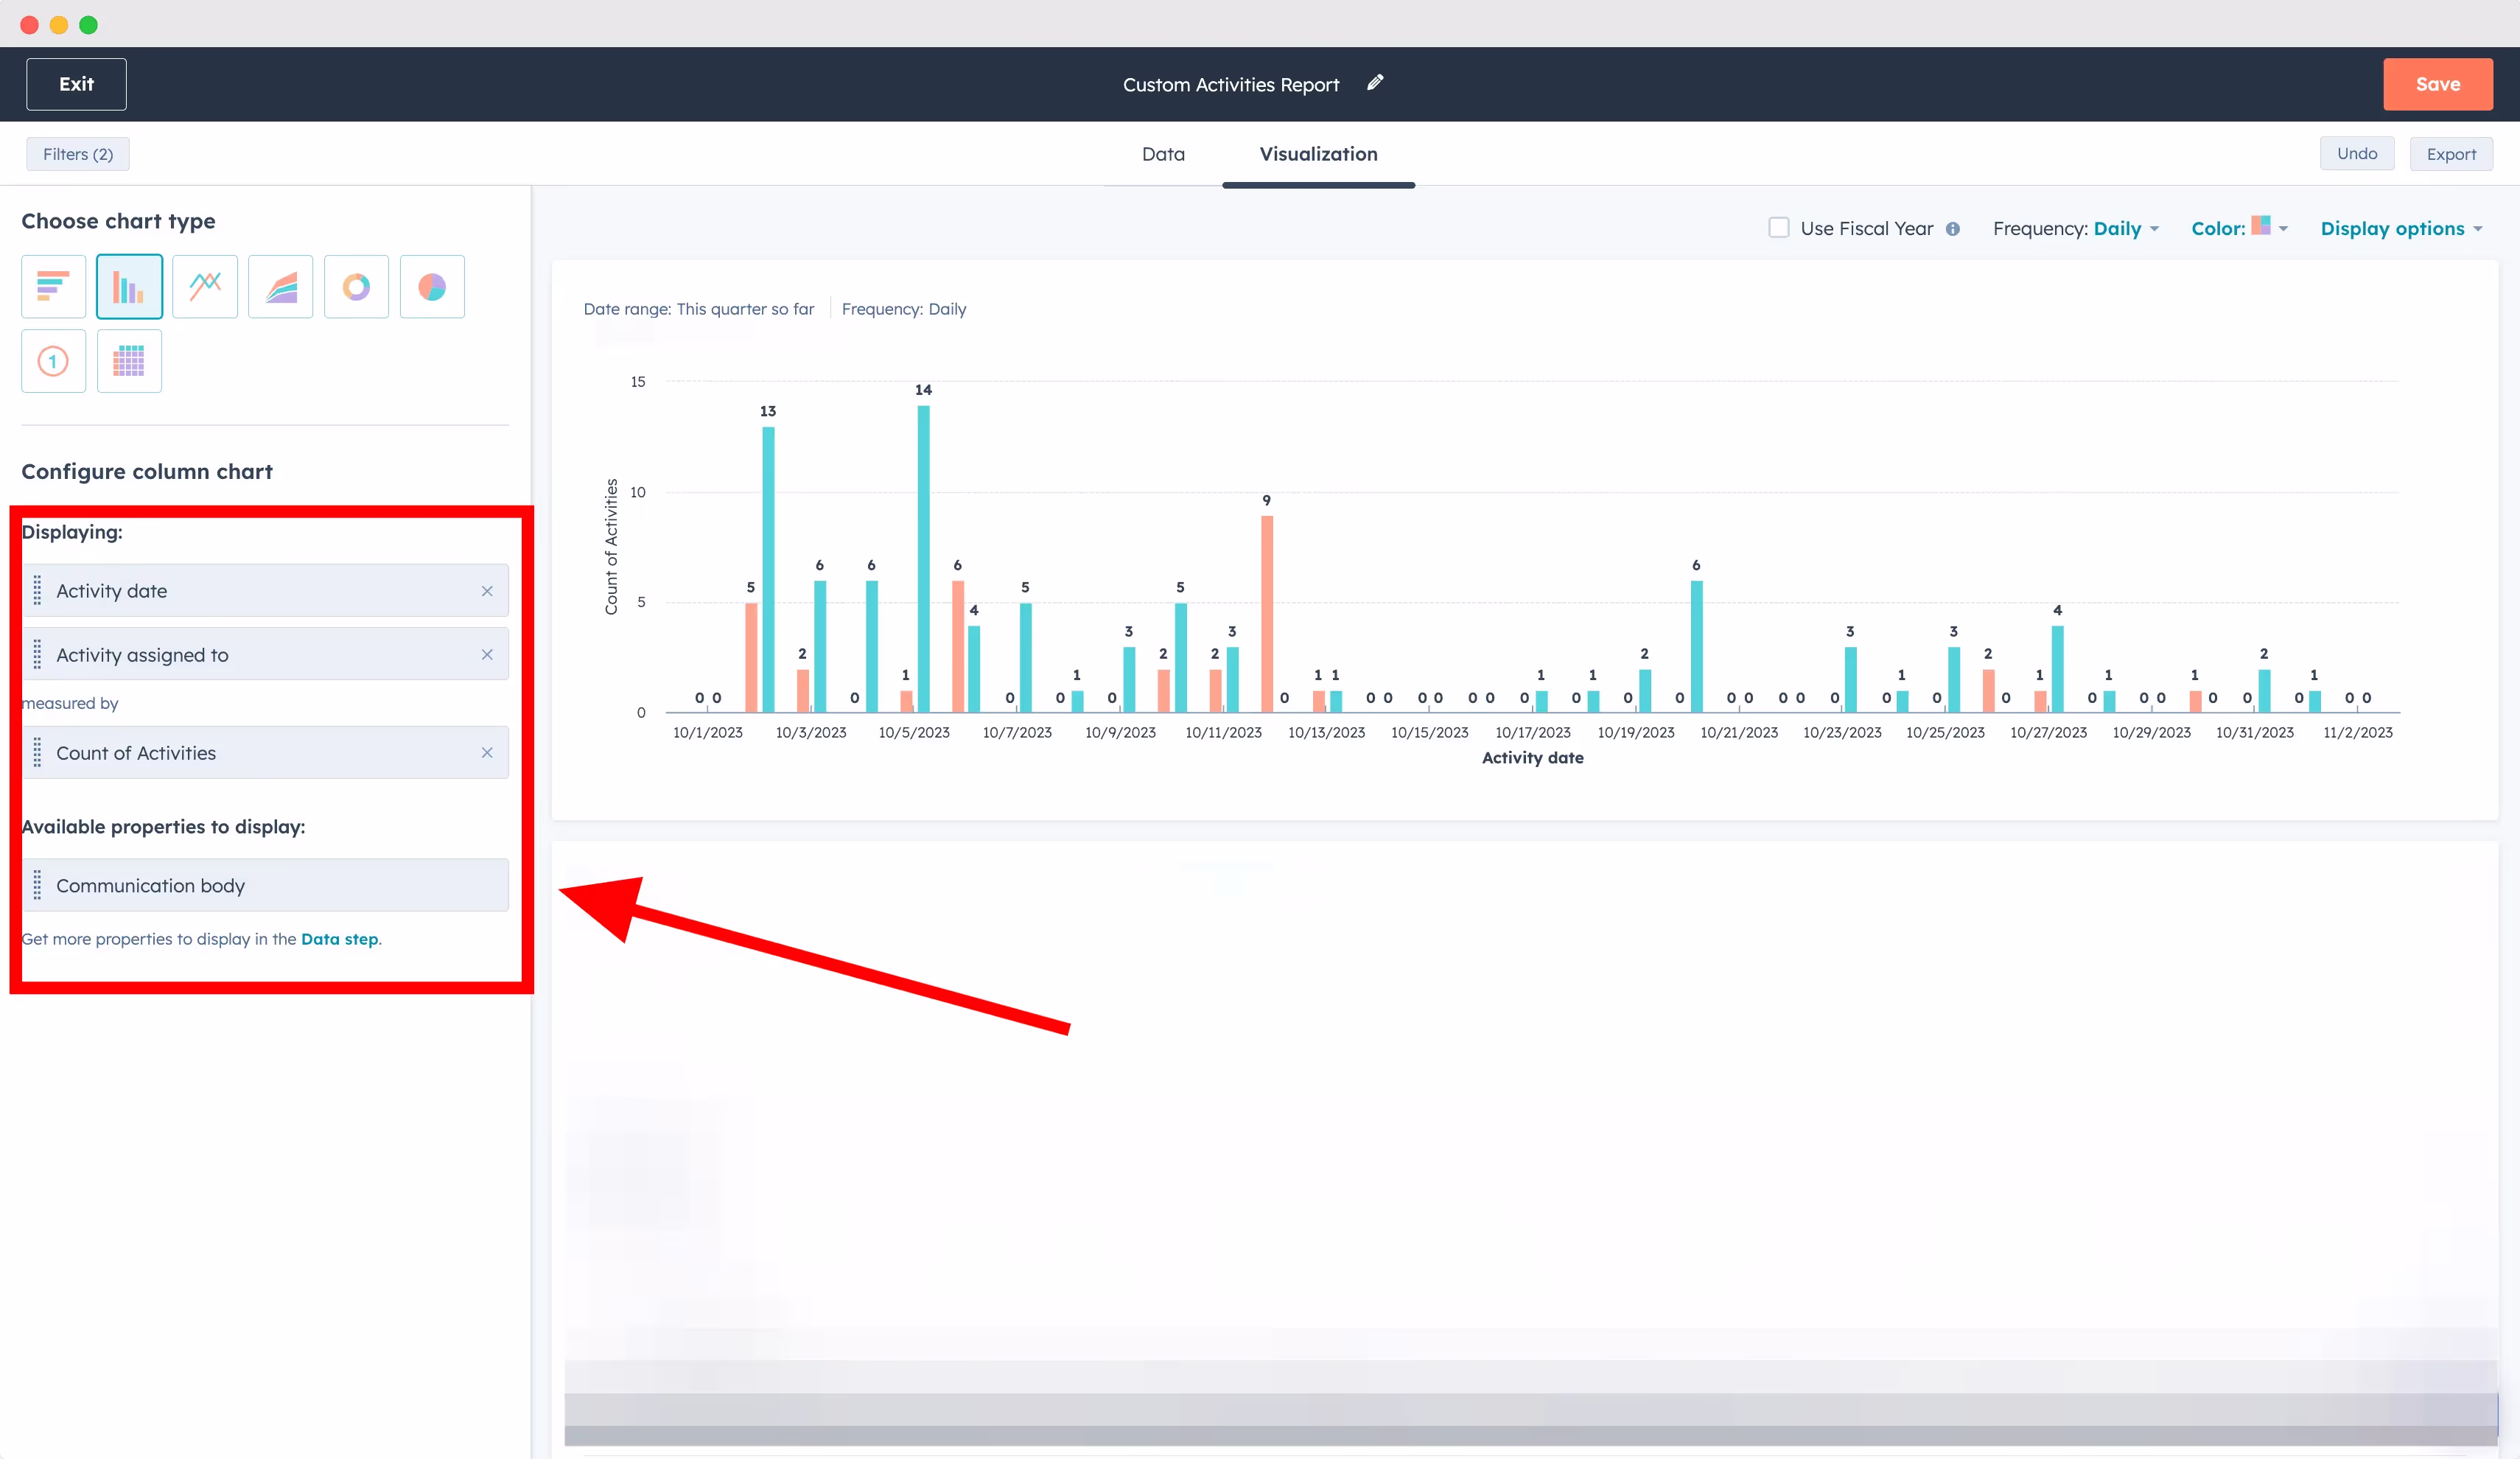
A. Add your HubSpot properties to the chart
- Select "Column" as Chart Type.
- In "Displaying" add: Activity Type & Activity assigned to.
- In "Measured by add "Count of activities"
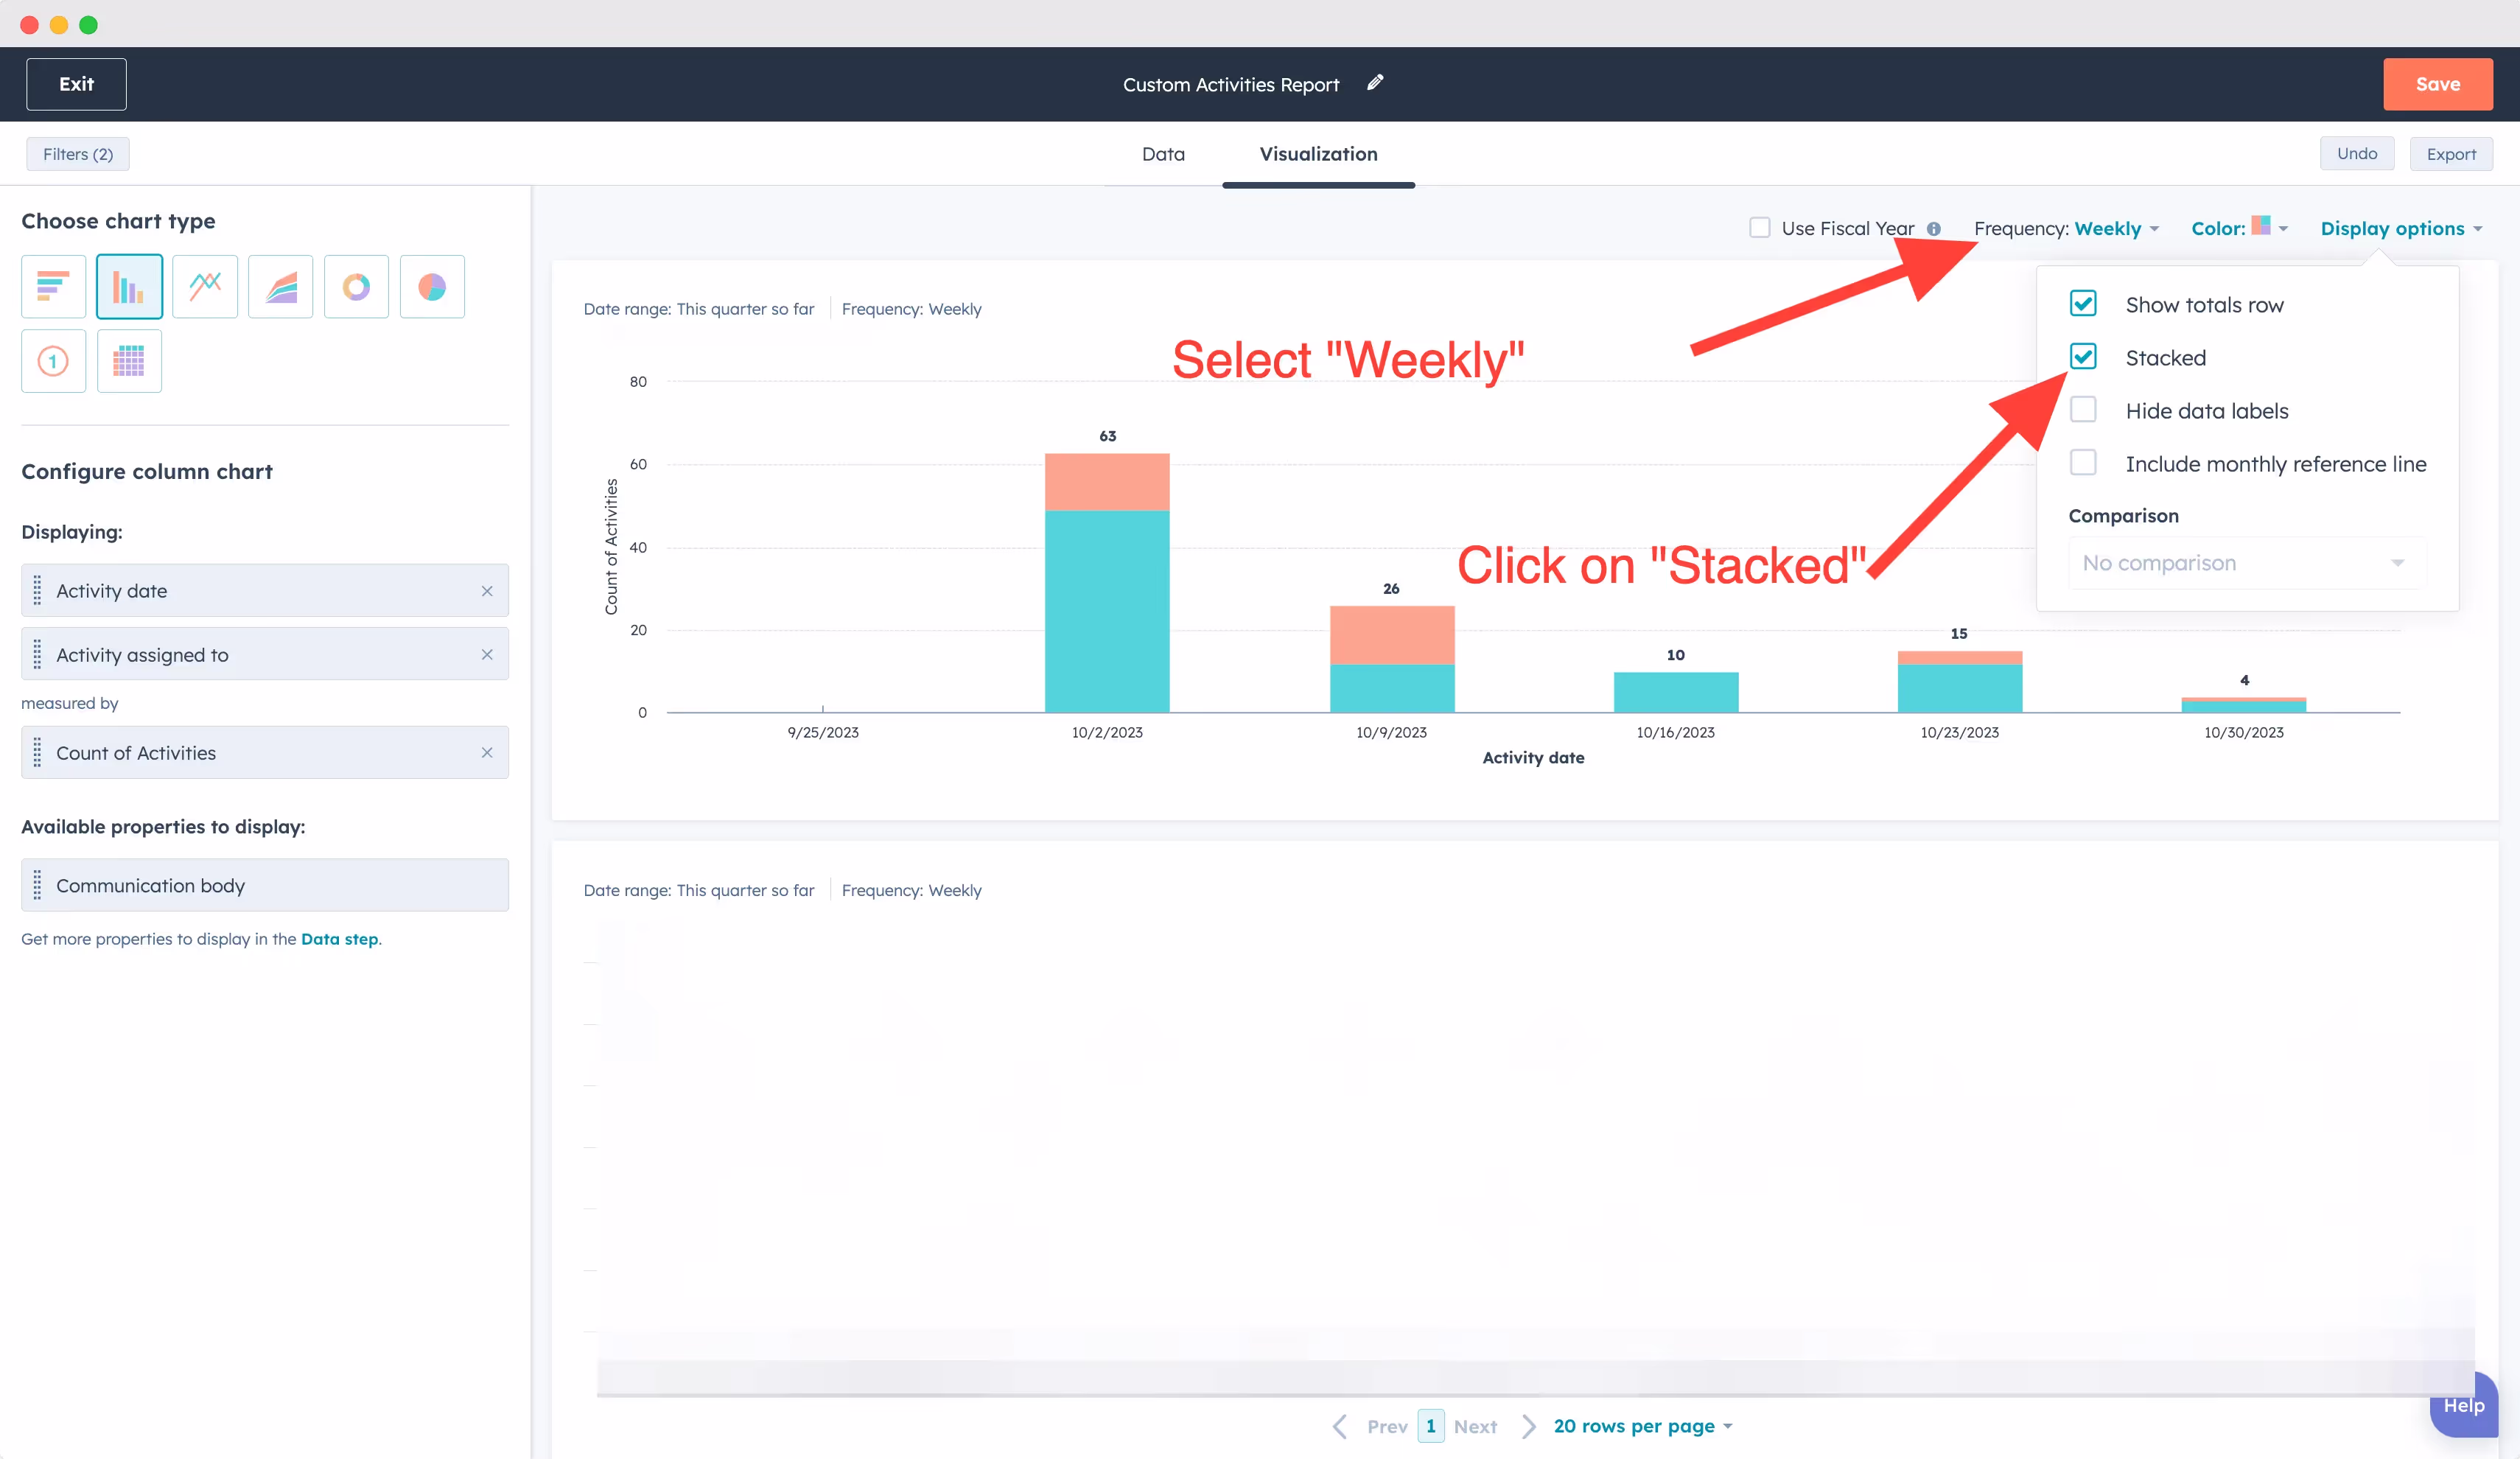
B. Make you report easier to analyse
- Select Weekly in "Frequency"
- Select "Stacked" in "Display options"
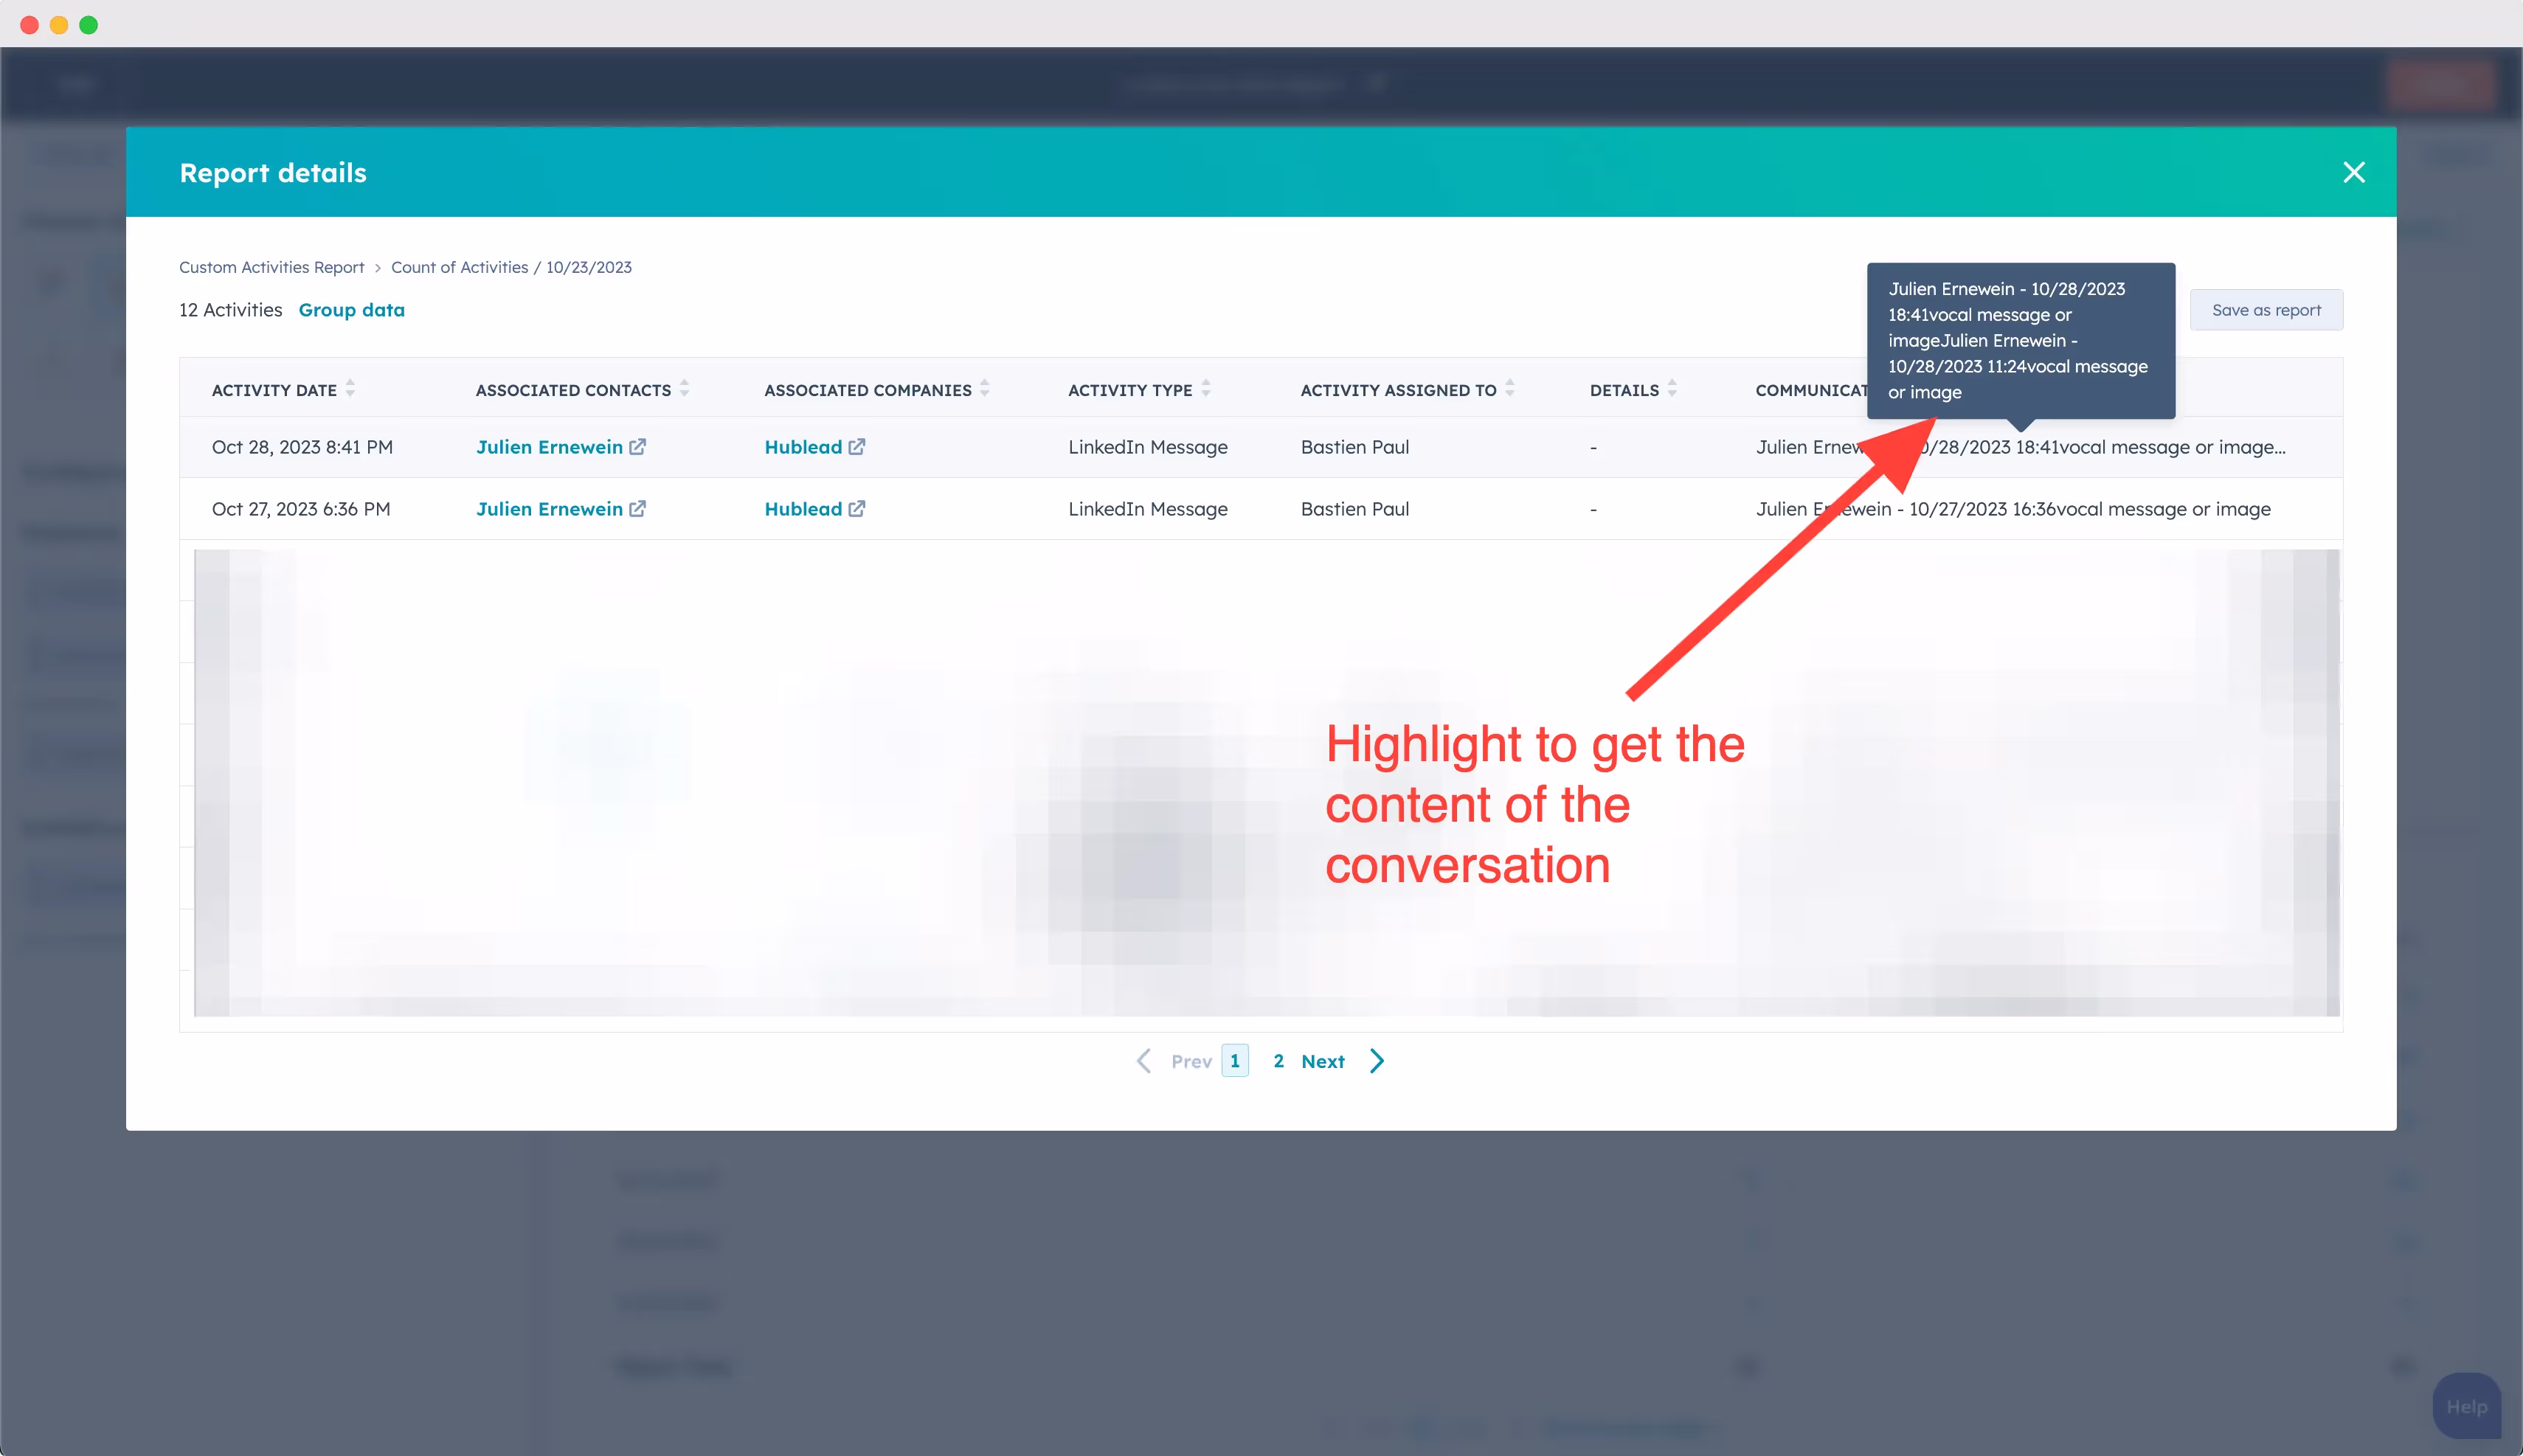
4. Get more insights from your report
A. Click on any week.
B. You can now see the conversation details.
Report on LinkedIn invitations
Step 1: Create a Custom Report Builder
First, navigate to the Reports section in your HubSpot account. Select the Custom Report Builder option to get started. This report will allow you to visualize and track the weekly number of LinkedIn connection requests sent.
Step 2: Set Contact as the Primary Source
In the custom report builder, set Contact as your primary data source. Since you’re tracking interactions with specific individuals, setting contact as the source ensures that the report captures data accurately.
Step 3: Select the Gauge Report Type
Now, select Gauge Report as the report format. The gauge report style is visually effective for showing progress toward specific targets or weekly tracking goals, making it an ideal choice for monitoring LinkedIn connection requests.
Step 4: Set Up a Custom Property for LinkedIn Connection Requests
To track LinkedIn connection requests, you’ll need a custom property. Here’s how to set it up:
1. Go to Settings > Properties in HubSpot.
2. Create a new property under the Contact category and name it “LinkedIn Connection Request Sent.”
3. Once the property is created, you can set up a workflow to update it each time a LinkedIn connection request is sent.
Follow this guide for a more detailed workflow setup: YouTube Guide to Updating Custom Properties.
Step 5: Set the Custom Property in the “Compare by” Field
In your report builder, go to the Compare by section and select the “LinkedIn Connection Request Sent” property. Adjust the settings to compare data weekly, so you can view trends and weekly progress on connection requests.
Step 6: Add “Record ID” in the Value Field
Finally, add the Record ID in the Value field. This step links the report back to individual contacts, allowing you to see the number of connection requests sent in a week and track which contacts were involved.